
Maps and Images
There are two options for importing images into Leapfrog Geo:
- Import them into the GIS Data, Maps and Photos folder. Use this option to import maps and photos that will be useful in tying 2D surface data into the 3D modelling environment. Once imported, you can drape images onto the topography surface, alongside GIS data in the project.
- Import them into the Sections, Plans and Contours folder using the New Cross Section From Image option. Use this option to import cross section images. You can then evaluate geological models, interpolants, distance functions and surfaces on the cross section and create a section layouts.
Using the GIS Data, Maps and Photos folder, you can also create a rendered plan view map in Leapfrog Geo from data displayed in the scene.
The first part of this topic describes:
- Importing Images
- Georeferencing Images
- Exporting a Georeferenced Image
- Displaying an Image in the Scene
These four subtopics apply to both images in the GIS Data, Maps and Photos folder and the Sections, Plans and Contours folder.
The remaining subtopics apply only to images imported into and created in the GIS Data, Maps and Photos folder. They are:
- Draping Images on the Topography
- Setting Elevation for Images
- Displaying an Image Draped on the Topography
- Displaying Images in Custom Topography Views
- Creating and Modifying Rendered Maps
Importing Images
You can import images into Leapfrog Geo in the following formats:
- Graphics Interchange Format Files (*.gif)
- JPEG Files (*.jpg, *.jpeg)
- PNG Image Files (*.png)
- Tag Image Files (*.tiff, *.tif)
- Windows Bitmap Files (*.bmp)
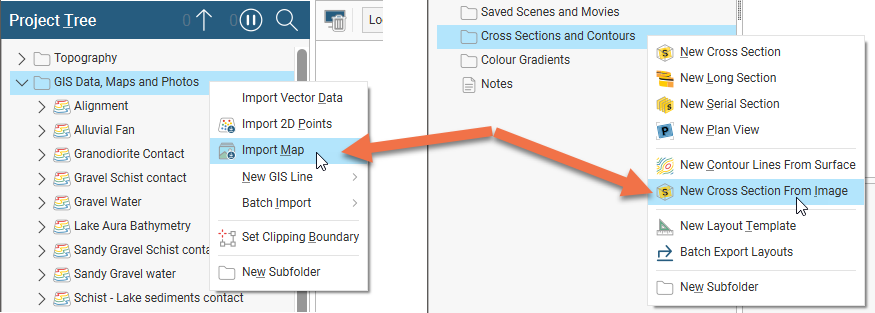
Whether you are importing maps and photos into the GIS Data, Maps and Photos folder or cross sections into the Sections, Plans and Contours folder, the image formats supported and the process are the same. To import an image, right-click on the folder in the project tree and select either Import Map or New Cross Section From Image, as required:
Navigate to the folder that contains the image file and select it. You can select multiple files using the Shift and Ctrl keys.
Click Open to import the file or files.
- If you are importing a single file that contains georeference data, it will automatically be added to the folder you are importing it into.
- If you are importing multiple files, all files will automatically be added to the folder you are importing them into, even those that do not contain georeferencing information.
- If you are importing a single file and it does not contain georeference data, an import tab will be opened in which you can add georeferencing information.
You can also drag and drop a file or multiple files from File Explorer into Leapfrog Geo. Select all the files you wish to import and drop them into the GIS Data, Maps and Photos folder or the Sections, Plans and Contours folder. All images will be imported and added to the folder. If an image does not contain georeference data, you will need to open the image and add the information manually, as described in Georeferencing Images below.
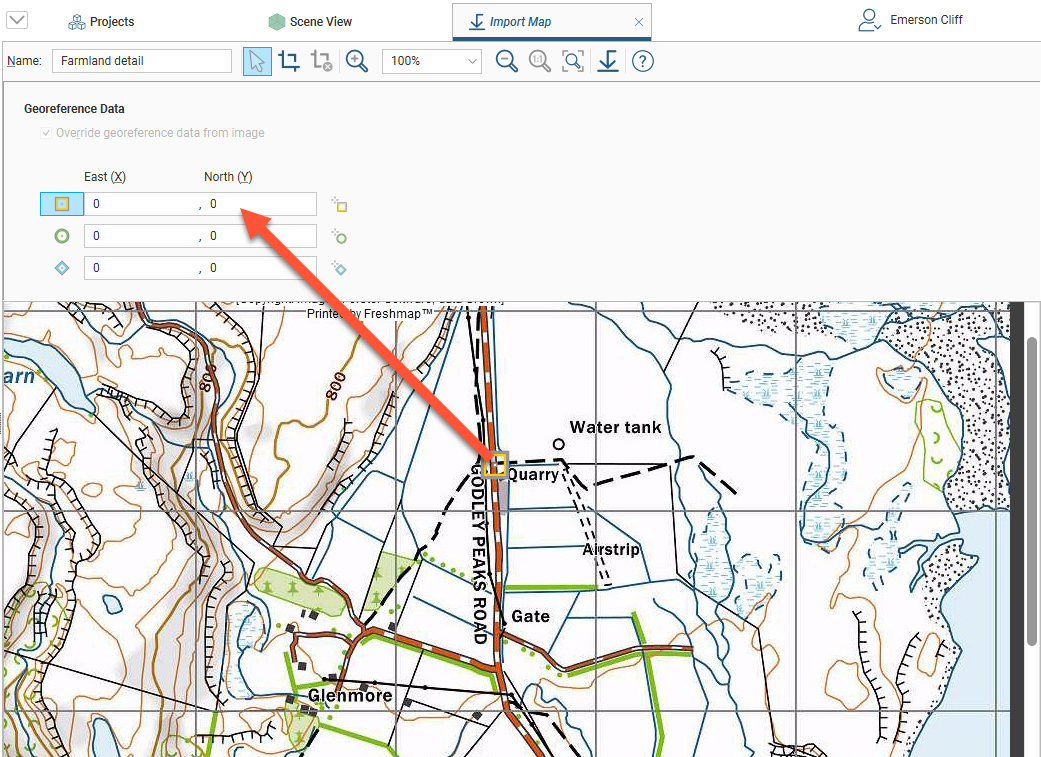
Here a single non-georeferenced map image is being imported into the GIS Data, Maps and Photos folder:
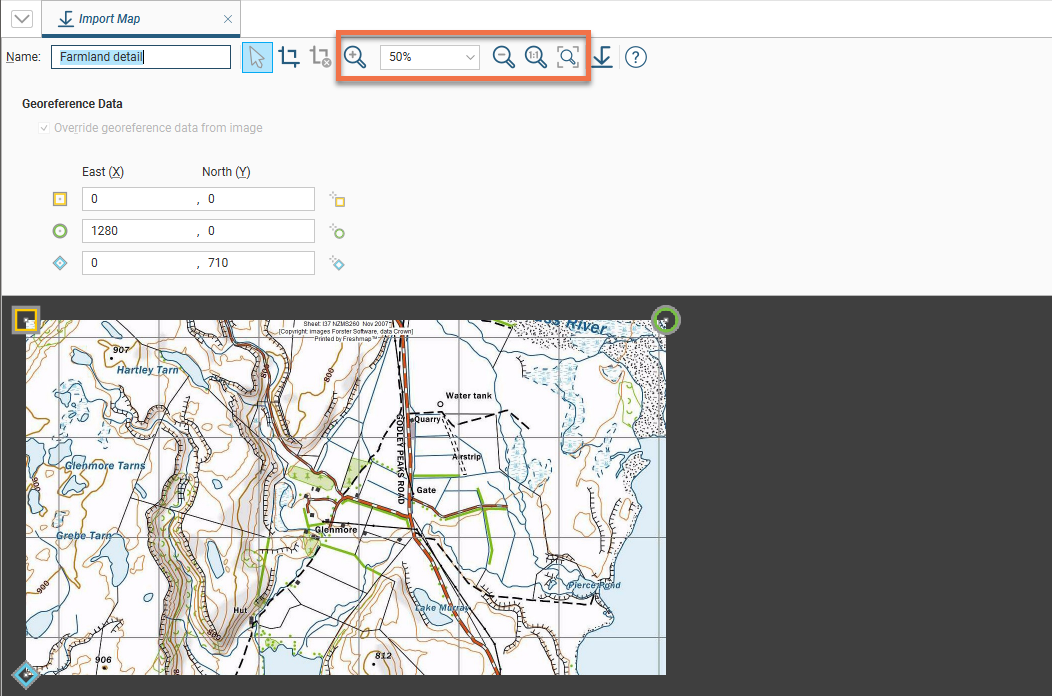
The three markers (![]() ,
, ![]() ,
, ![]() ) are used to display the georeference data for imported images. For images that do not contain georeference data, you need to enter coordinates for each of the markers, which is described in Georeferencing Images below.
) are used to display the georeference data for imported images. For images that do not contain georeference data, you need to enter coordinates for each of the markers, which is described in Georeferencing Images below.
Use the controls in the toolbar to zoom in and out of the image. The Import button (![]() ) imports the image and closes the window, regardless of whether or not you have set the georeference information.
) imports the image and closes the window, regardless of whether or not you have set the georeference information.
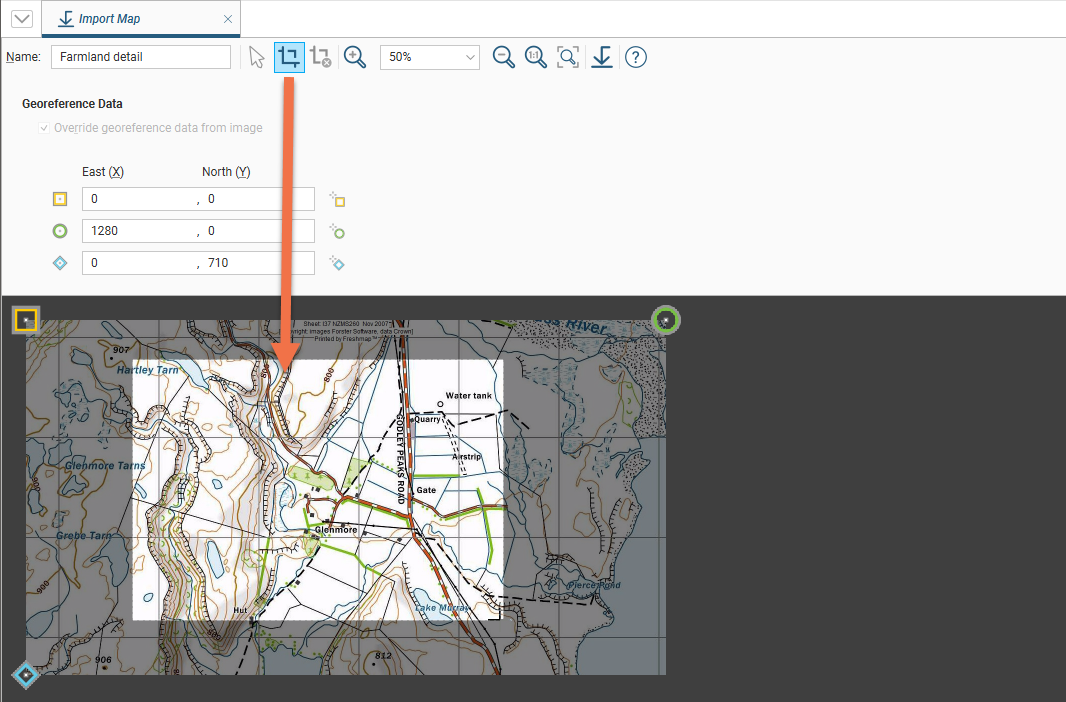
You can also use the Crop Image button (![]() ) to crop the image to only the area of interest. This will reduce video RAM usage and may improve graphics performance.
) to crop the image to only the area of interest. This will reduce video RAM usage and may improve graphics performance.
Images larger than 16384 by 16384 pixels will be scaled down. Reducing your images in size below this limit will avoid scaling. You can scale down images in an external image editor, or you can crop imported images in Leapfrog Geo.
To crop an image, click on the Crop Image button (![]() ) and then drag around the part of the image you wish to use.
) and then drag around the part of the image you wish to use.
Click on the Remove Crop button (![]() ) to clear the cropping.
) to clear the cropping.
The process for importing an image into the Sections, Plans and Contours folder is similar, except that there are additional controls for specifying the section type and once the image has been imported, a Leapfrog Geo section is created in the project tree.
Here a single non-georeferenced section image is being imported into the Sections, Plans and Contours folder:
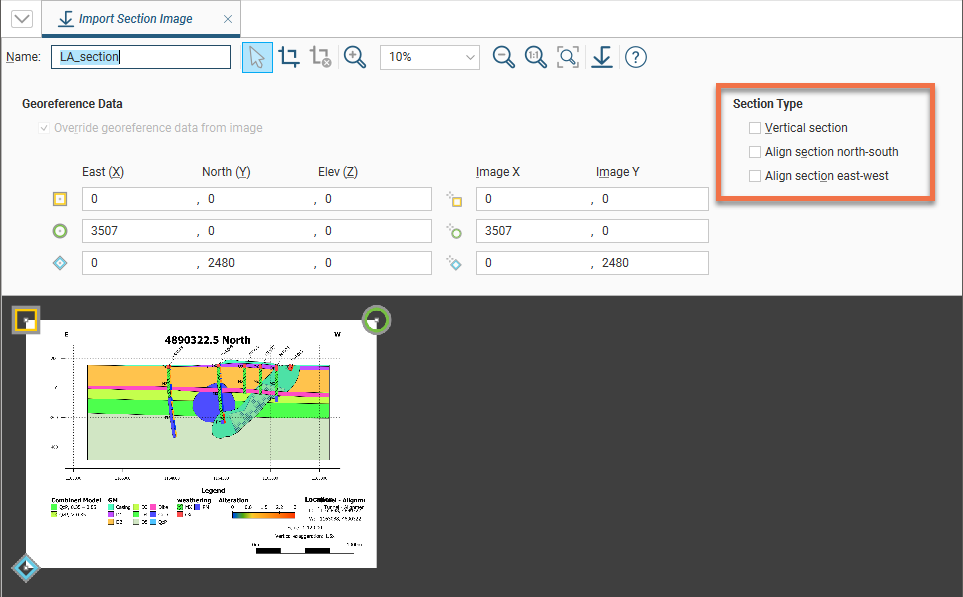
You only need to enter coordinates for the yellow and green markers for vertical sections. Enable the Vertical section option, which removes the blue marker row:
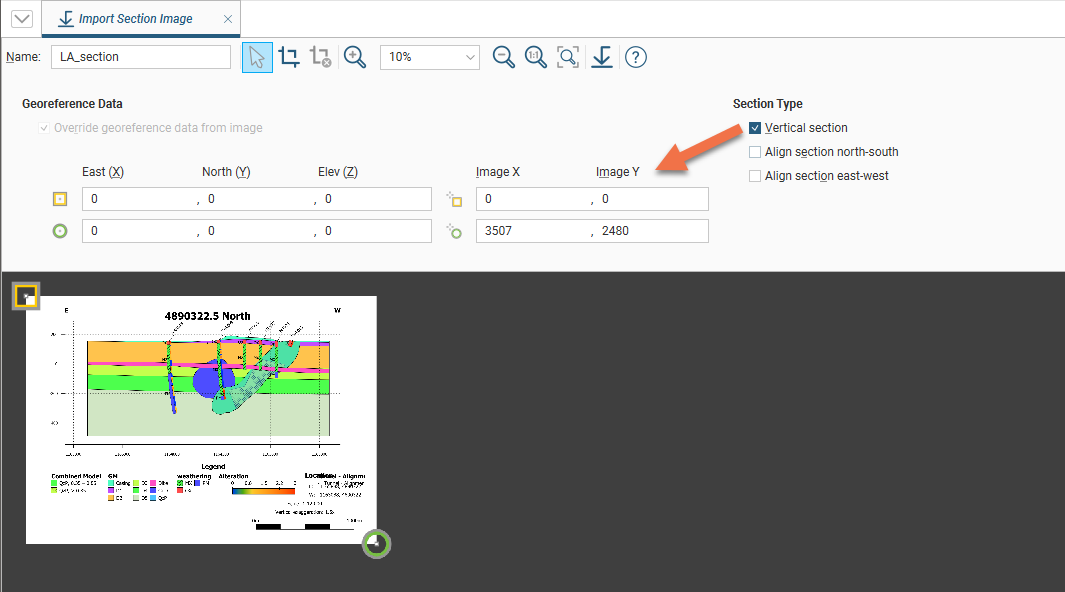
If your image is a north-south or east-west section, enable the corresponding Align section option.
Once you have imported the section image, it will appear in the project tree under a new section:
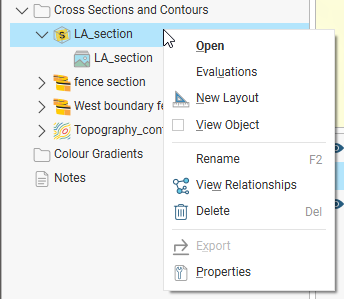
You can evaluate geological models, interpolants, distance functions and surfaces on the section and create section layouts. See Evaluations. and Section Layouts for more information on these options.
Georeferencing Images
In Leapfrog Geo, three markers (![]() ,
, ![]() ,
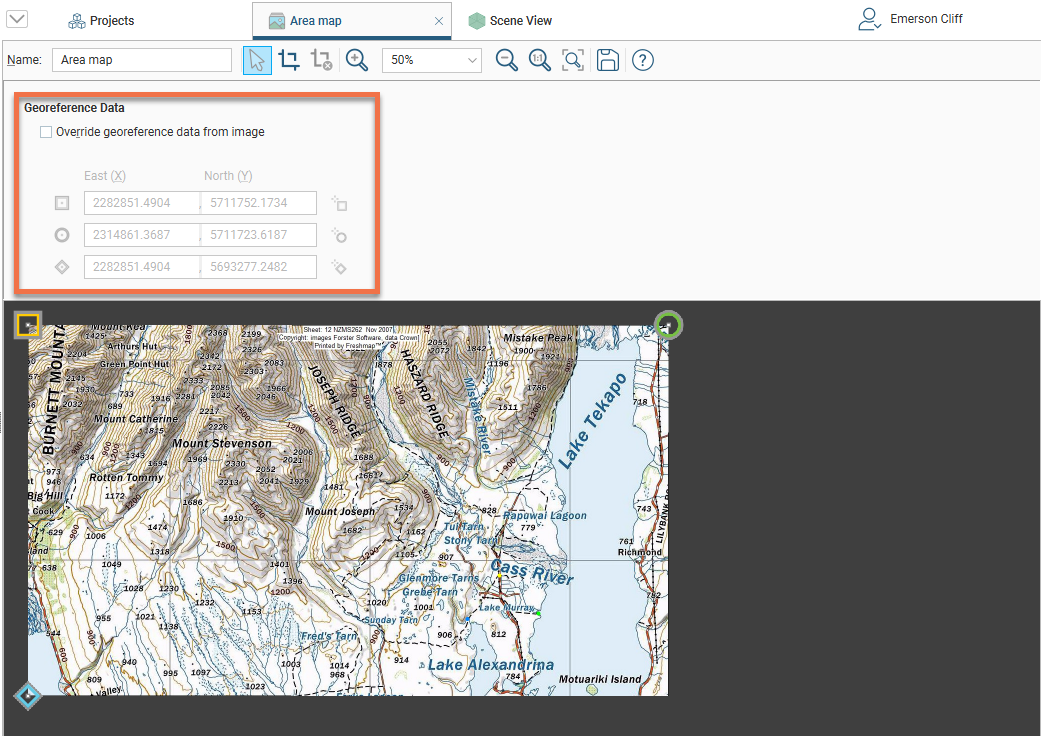
, ![]() ) are used to set the georeference data for imported images. You can see these markers when you double-click on an imported image, which opens an image tab where you can edit the image’s georeference data. In this example, the georeference data is greyed out because the image contains that data:
) are used to set the georeference data for imported images. You can see these markers when you double-click on an imported image, which opens an image tab where you can edit the image’s georeference data. In this example, the georeference data is greyed out because the image contains that data:
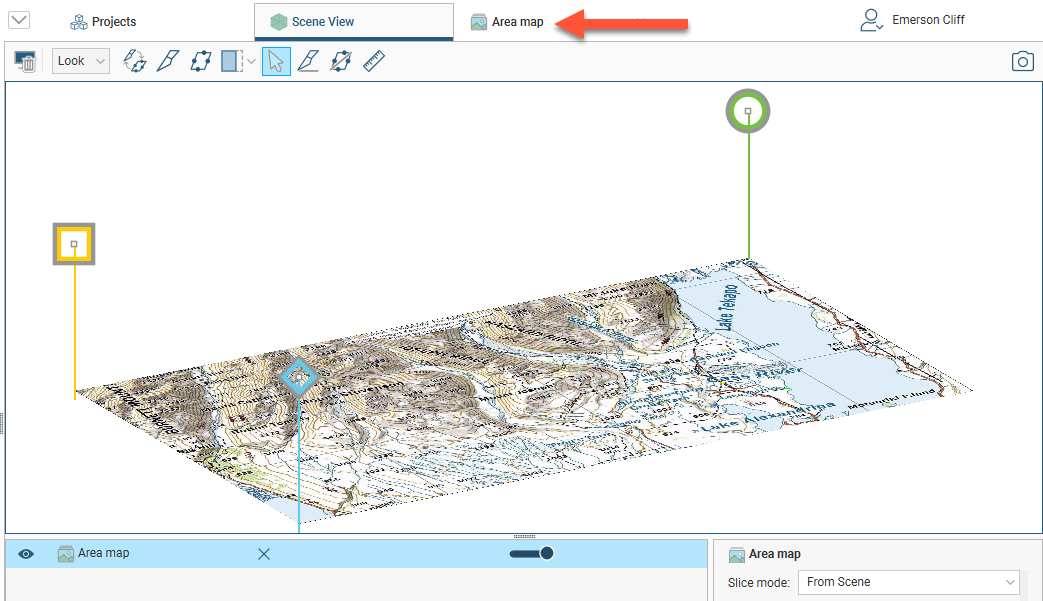
In the image tab, there are two sets of markers. The first set of markers is for marking a location in the image tab; the second set of markers is for copying location information from the scene into the image tab.
This is explained in more detail below.
When you switch between the image window and the scene, you can see the georeferencing markers:
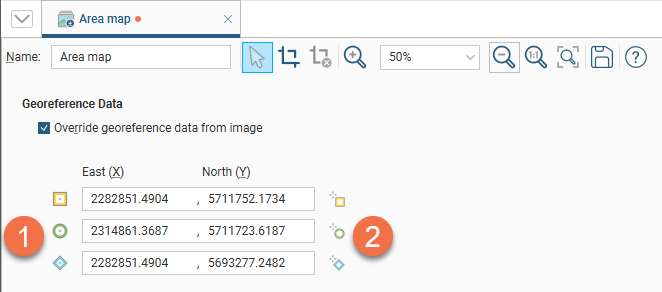
In most cases where images containing georeference data are imported into a project, you do not need to make any changes to this data. If, though, an image appears to be distorted when displayed in the scene, you may need to edit the georeference data. To do this, tick the box Override georeference data from image and you will be able to edit the three markers, as described below.
To position one of the three reference markers (![]() ,
, ![]() ,
, ![]() ) in the image tab, click on a marker button, then move it to the required location in the image tab using the mouse or the arrow keys. Once each marker is correctly positioned, enter the real-world X and Y coordinates for each marker:
) in the image tab, click on a marker button, then move it to the required location in the image tab using the mouse or the arrow keys. Once each marker is correctly positioned, enter the real-world X and Y coordinates for each marker:
There are two ways to do this:
- Enter the coordinates for each marker in the East (X) and North (Y) fields. As you enter the coordinates, the positions of the markers will be displayed in the scene.
- Copy coordinates from the scene using the three copy markers (
 ,
,  ,
,  ).
).
The second method is useful when you already have other objects correctly georeferenced in the project. For example, if you have another map or some polylines or points in the project and wish to import a map that aligns perfectly, you can reference the imported image directly against the existing project data.
Tear off the dockable image tab so it floats over the scene view and move it so you can see enough of the scene to work in both windows. Once you have positioned your points, click the Save button rather than closing the image window so you will be able to preview the results and make adjustments as needed.
To manually georeference the imported image using the three copy markers:
- In the image tab, position the marker (
 ,
,  ,
,  ) on the image being imported.
 - Click the corresponding copy coordinates marker (, , ).
- Click in the scene the point corresponding to where in the image tab the marker was placed.
The coordinates in the scene will be entered into the image tab.
If the alignment is not perfect, make adjustments to improve the match. There are two ways to make these adjustments:
- In the scene window, zoom in to the point where you wish to place a copy-coordinates marker (, , ), click the marker in the image tab, then click the point in the scene zoomed in, or
- In the image tab, zoom in to the point where the reference marker has been positioned and adjust the location.
Click the Save button to preview the change before closing the image tab.
Exporting a Georeferenced Image
If you have georeferenced an image you imported into Leapfrog Geo, you can export the image as a GeoTIFF. To do this, right-click on the image in the project tree and select Export. You will be prompted for a filename and location. Click Save.
Displaying an Image in the Scene
To display an image in the scene, either drag it from the project tree into the scene or right-click on it in the project tree and select View Object. This displays the image at a fixed elevation, which can be changed as described in Setting Elevation for Images above.
If nothing is displayed when you add an image to the scene, it may be that it does not contain georeference data. This could be the case if you imported multiple images and some of them did not contain georeference data. To add georeference data, double-click on the image in the project tree and add the coordinates as described in Georeferencing Images above.
Draping Images on the Topography
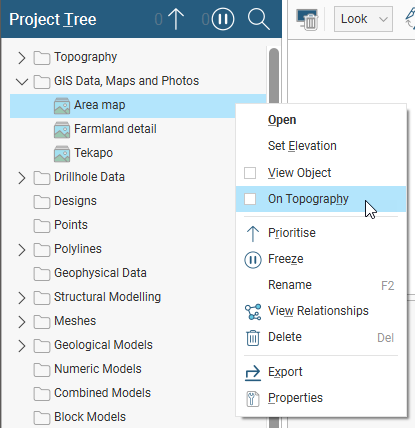
Images imported into the GIS Data, Maps and Photos folder can be draped on the topography. To do this, right-click on an image in the project tree and tick the On Topography box:
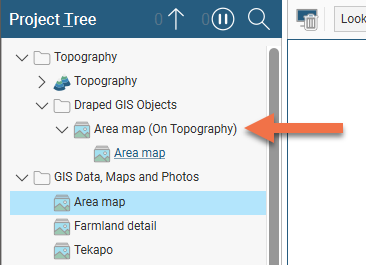
The draped version of the image will be added to the Draped GIS Objects folder under the Topography folder:
In versions of Leapfrog Geo before 2022.1, GIS data objects and images imported into the GIS Data, Maps and Photos folder were automatically draped on the topography. When you upgrade projects in Leapfrog Geo 2022.1, objects already draped will remain draped, and you can choose to remove them from the topography, if you wish.
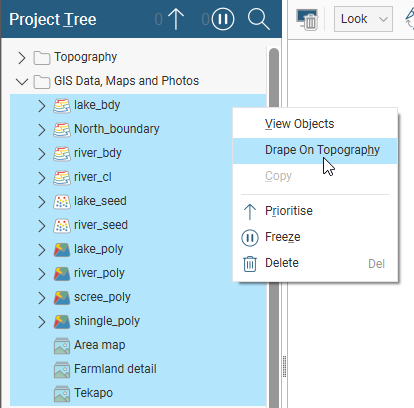
You can drape multiple images and/or GIS data objects on the topography in one action by using the Shift and Ctrl keys to select the objects you wish to drape, then right-clicking on them and selecting Drape On Topography:
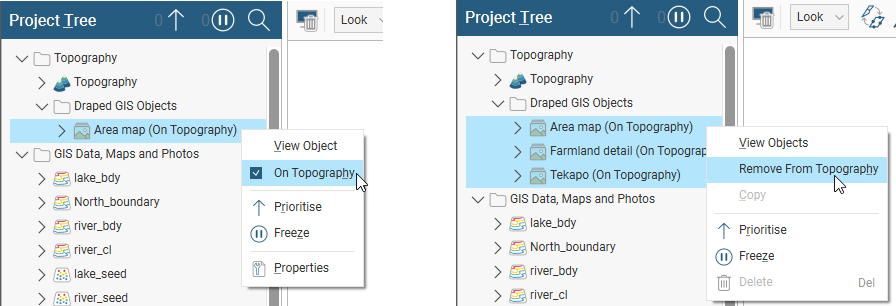
To remove an object from the topography, right-click on either it or its draped copy in the Draped GIS Objects folder and untick the On Topography box. For multiple objects, select Remove From Topography.
Setting Elevation for Images
You can change the elevation for images imported into the GIS Data, Maps and Photos folder by right-clicking on them in the project tree and selecting Set Elevation. In the window that appears, enter the elevation value you wish to use, then click OK.
Displaying an Image Draped on the Topography
To display an image using the topography’s elevation data, first drape the image on the topography as described in Draping Images on the Topography above.
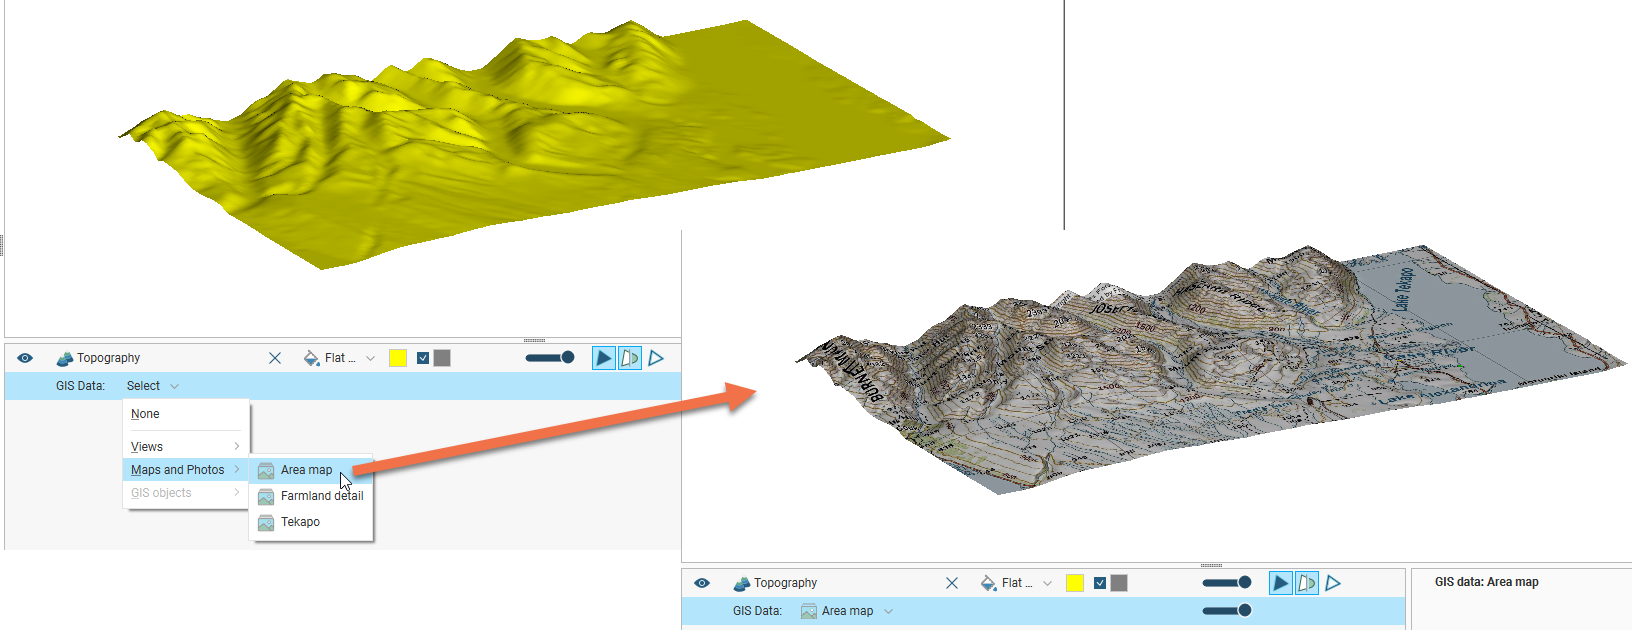
Next, add the topography to the scene and in the shape list, click on the topography’s GIS Data list. Select the image you wish to view from the Maps and Photos submenu:
Displaying Images in Custom Topography Views
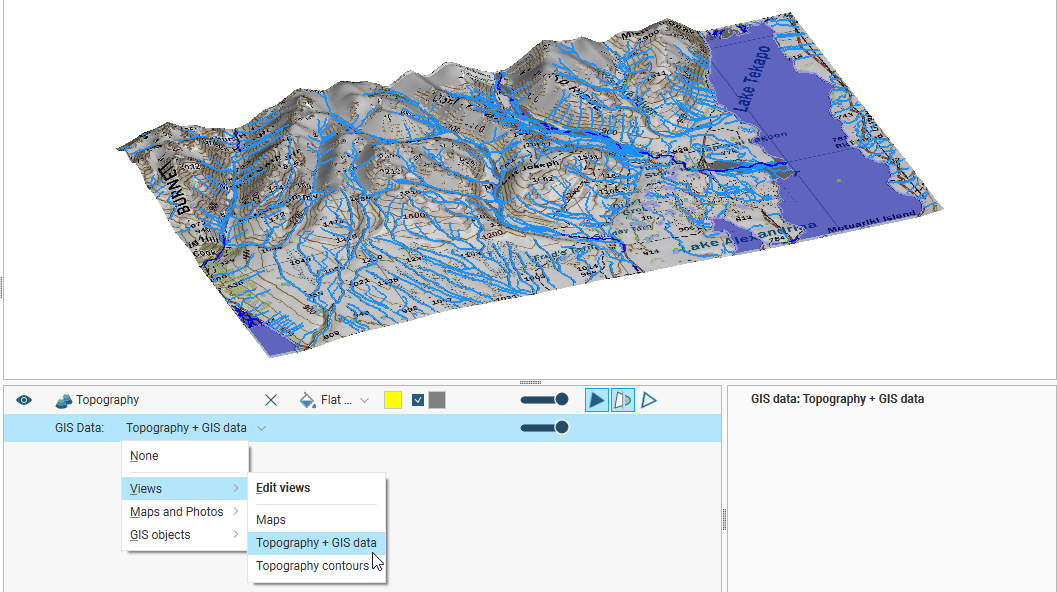
With custom topography views, you can display multiple images along with GIS data objects draped on the topography. For example, here a map is displayed along with GIS data:
To find out more about creating a custom topography view, see Custom Topography Views in the Defining a Topography topic.
Creating and Modifying Rendered Maps
A rendered map is an overhead representation of the scene as a snapshot.
A rendered map is different from a saved scene in that a saved scene can provide a view from any given perspective, and while the scene is restored using the original settings, the data is dynamic so the saved scene may show something different to the view when the scene was saved.
A rendered map is different from a plan view in that it does not require a plan view layout to define the appearance; instead the scene building tools are used. A plan view will also dynamically update according to changes made in the data, rather than providing a snapshot as a rendered map does. A plan view cannot be exported as a georeferenced TIFF (GeoTIFF) file, but a rendered map can.
Creating Rendered Maps
To create a rendered map, first arrange objects in the scene according to the view you would like to present. You can use the slicer set to Thick Slice or Remove Front to cut through a model and reveal interior details. While viewing the scene, press the D key on the keyboard to get a 'down' overhead perspective similar to the view that will be rendered on the map. This is not required to render the map from an overhead perspective as this will happen automatically, but it does help to visualise the result in advance. Right-click on the GIS Data, Maps and Photos folder in the project tree and select New Rendered Map. Adjust the desired map extents using:
- The handles in the scene
- The X and Y Minimum and Maximum fields to set coordinates for the region
- Select Enclose Object and choose from the list of available objects
Specify the size of the rendered map by selecting options between 1MP and 70MP from the Select Image Size list.
You can customise details added to the rendered map by clicking the Overlay Settings button. In the Map Settings window, you can choose to overlay a screen grid, by ticking the Show screen grid box. There are also four grid spacing options to choose from:
- Loose Spacing
- Medium Spacing
- Fine Spacing
- Extra Fine Spacing
You can separately choose to overlay axis lines by ticking the Show axis lines box, and whether or not you want to Put numbers on axis lines drawn.
Ticking the Scale bar box will add a scale marker to the map.
The Show scene legends option will only become available if objects in the scene have Show legend in scene enabled in the shape list. When ticked, the same legend seen in the scene will also appear on the rendered map.
The Show plan section depth option will only become available if:
- The Setting > Scene > Overlays > Slicer position text option is enabled, and
- A slicer is drawn onto the scene, and
- The slicer Dip parameter in Shape Parameters is set to 0.
The Show plan section depth option refers to the slicer depth, not to plan view sections.
Click Close on the Map Settings window and then OK on the Edit Map window to create the rendered map.
You can view the rendered map in the scene by dragging it from the project tree into the scene. To change the elevation where the rendered map appears in the scene, right-click on the map in the project tree and select Set Elevation.
To obtain an image that can be used in other applications, right-click on the rendered map in the project tree and select Export to save it as a GeoTIFF file.
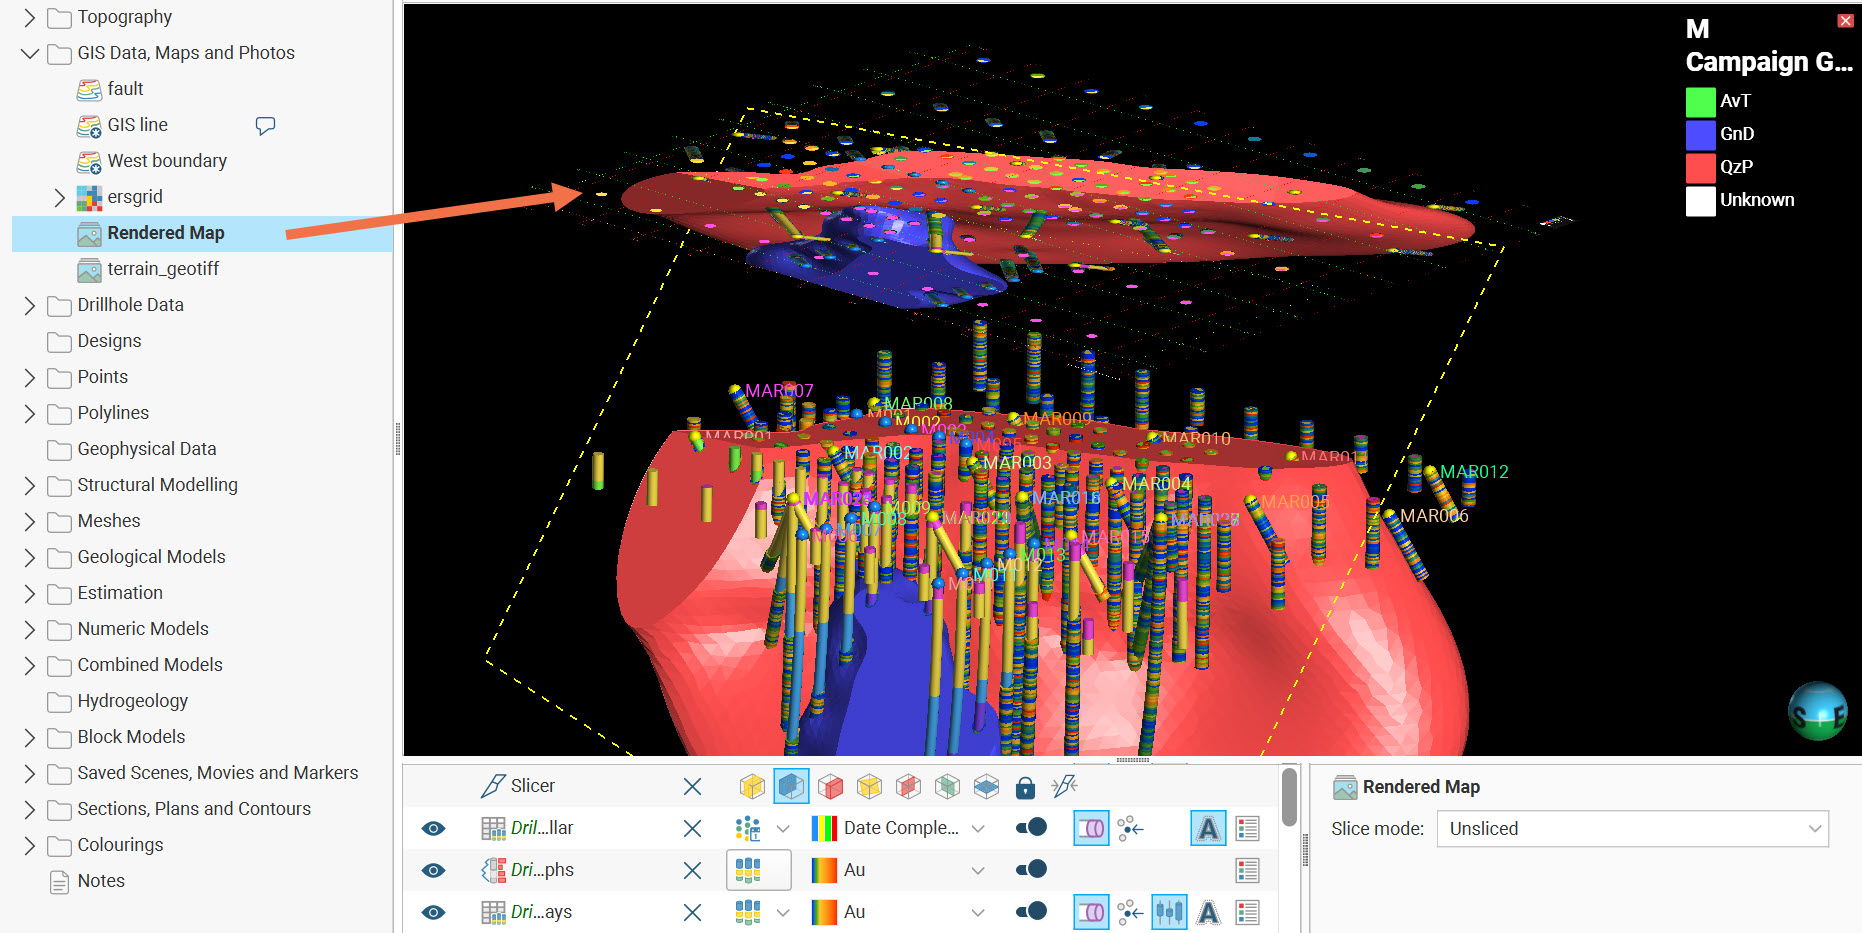
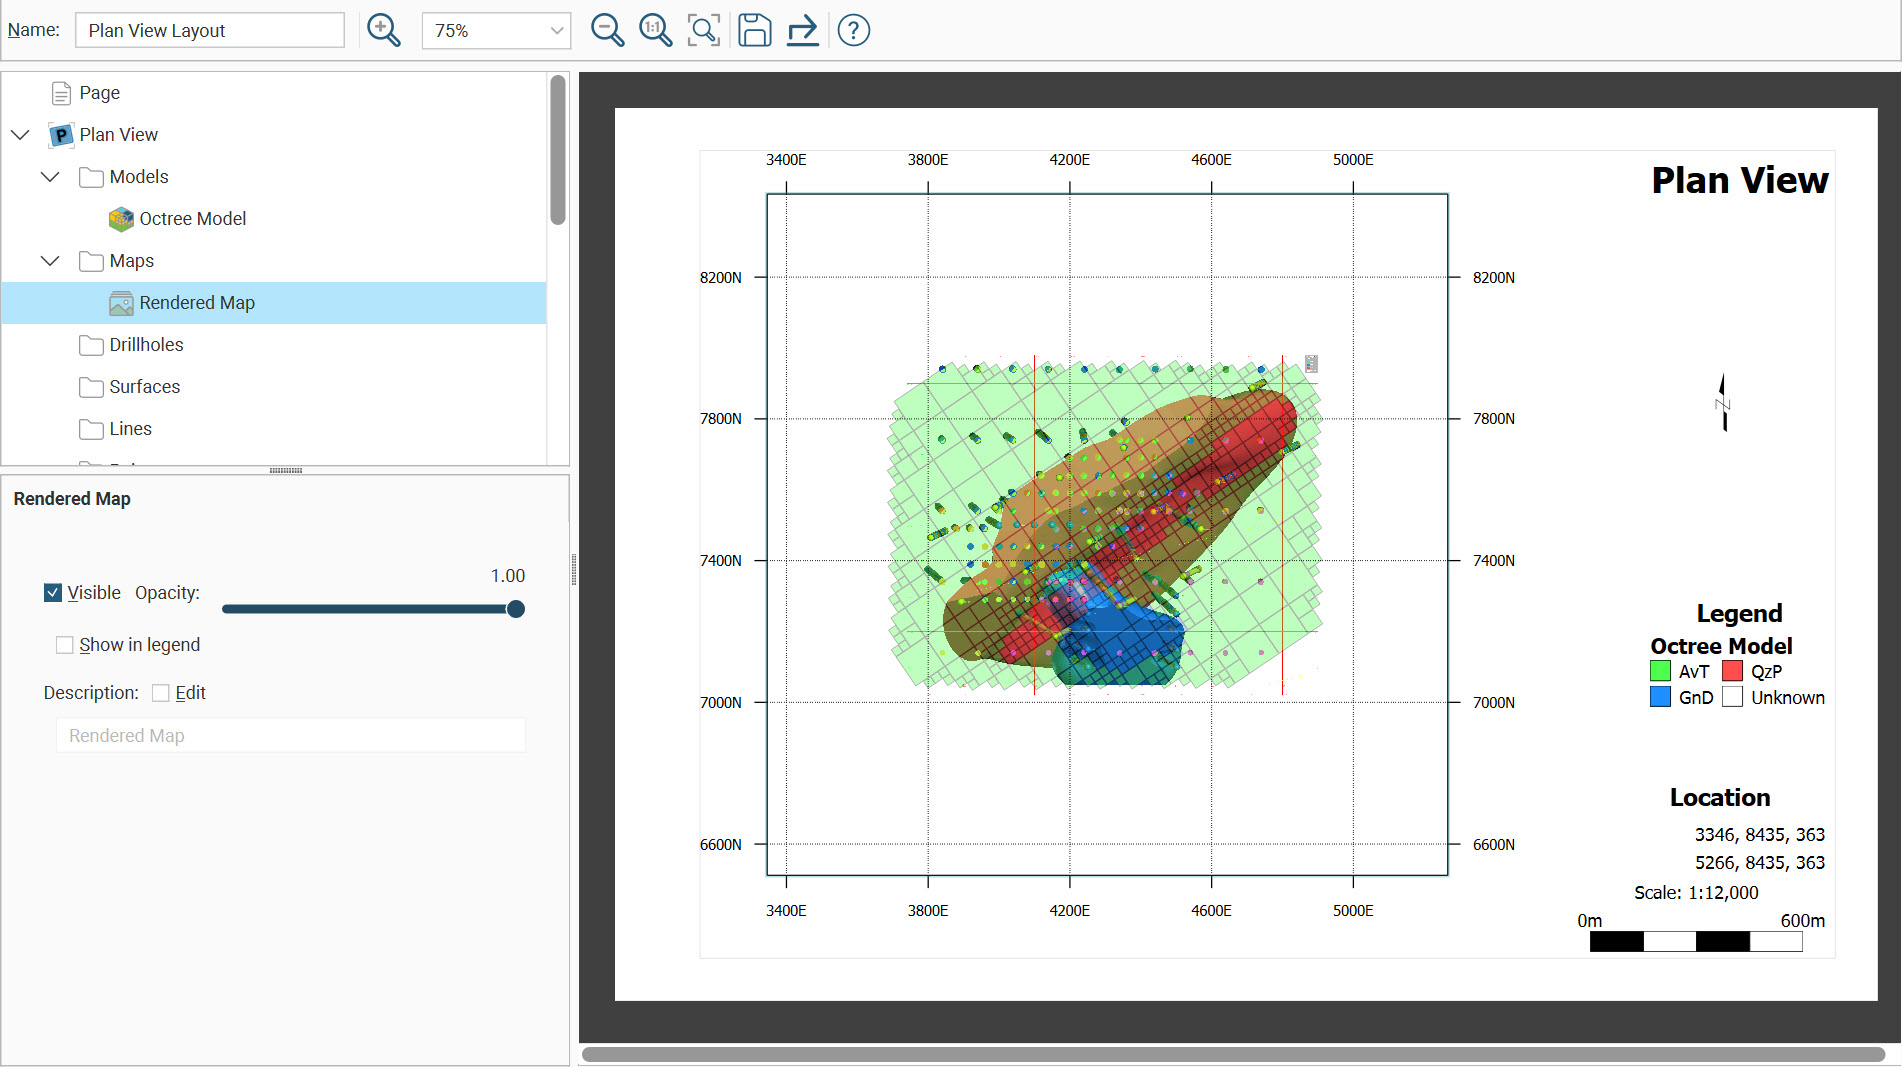
Another use for the rendered maps is as an object that can be added to plan view layouts. The rendered map can provide context to the plan view by showing internal details that are not limited to a flat horizontal section slice. In the plan view's layout tree, right-click on the Maps folder, select Add Map then select a rendered map. Here a rendered map displays an overhead scene of some lithology volumes, revealing what is responsible for the details seen in the flat section through a block model:
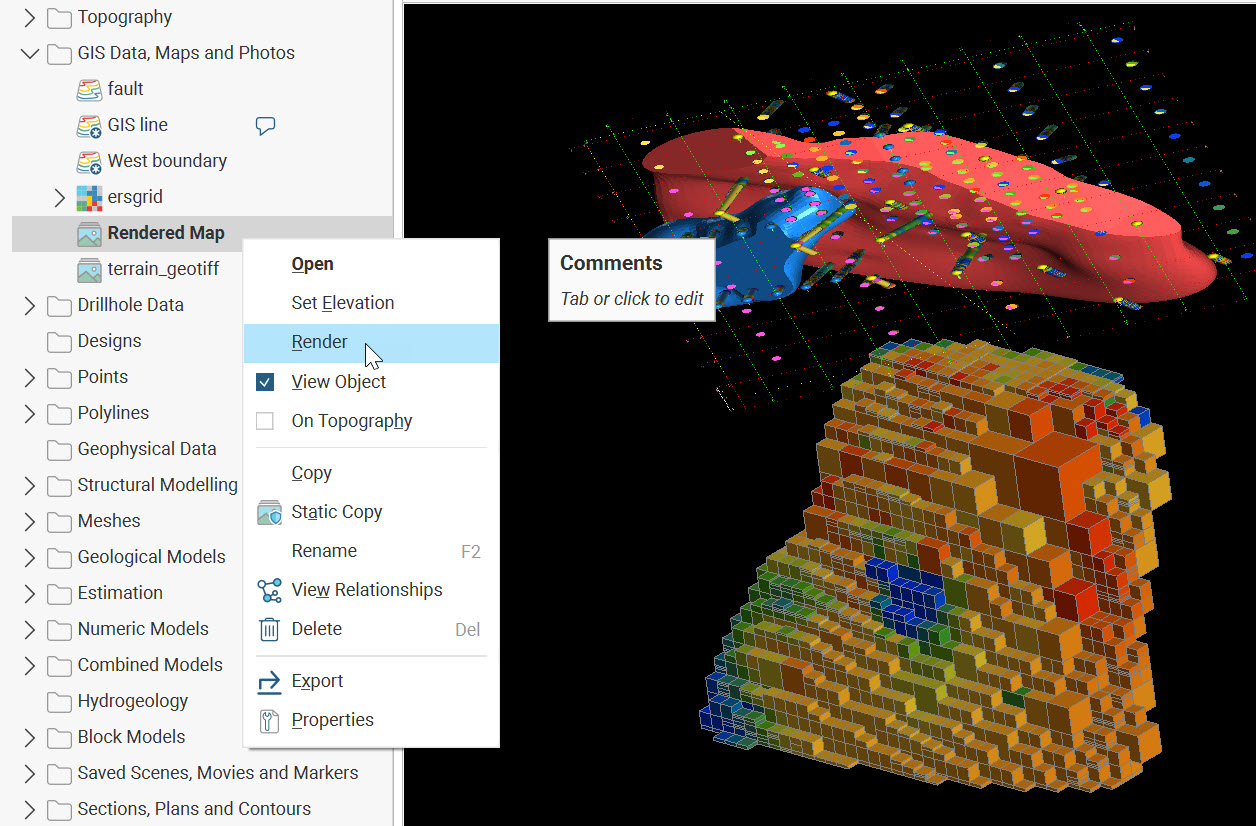
Modifying and Updating Rendered Maps
A rendered map will not dynamically update as the data in the project changes; it simply maintains a snapshot of the scene as it was when the map was rendered. It is, however, possible to re-render the map to refresh the map to display current details and information. Just as a saved scene restores the scene using the settings in place when the scene was saved, re-rendering a rendered map uses the original scene settings in place when the map was created, not necessarily what is currently displayed in the scene. To re-render the map, right-click on it in the project tree and select Render.
Got a question? Visit the Seequent forums or Seequent support
© 2023 Seequent, The Bentley Subsurface Company