
Introduction to Drilling Data in Leapfrog Geo
Drilling data forms the basis for creating models in Leapfrog Geo. Import drilling data by right-clicking on the Drillhole Data folder and selecting one of the import options:
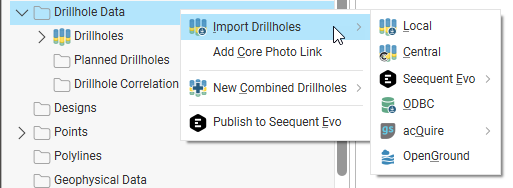
Each of these options is discussed in the Importing Drilling Data topic.
Because drilling data often contains errors that reduce the reliability of a model, Leapfrog Geo has tools that help you to identify and correct errors and work with the data. These tools are described in the Identifying and Correcting Data Errors in Leapfrog Geo topic.
The rest of this topic discusses:
See the separate Displaying Drilling Data topic for information on the different ways of displaying drilling data in the scene.
How Drilling Data is Organised in Leapfrog Geo
In Leapfrog Geo, drilling data is organised into drilling datasets, which are made up of a collar file, a survey file and at least one interval table. A drilling dataset can also contain:
- Downhole points
- LAS points
- Downhole planar structural data
- A screens table, if you have the Hydrogeology extension
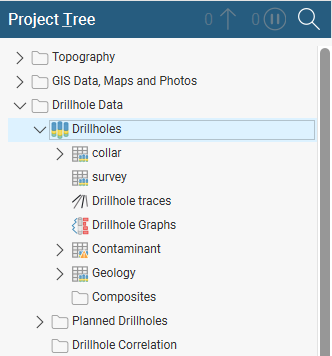
Here, a single drilling dataset made up of a number of tables has been added to the project, stored in the Drillhole Data folder:
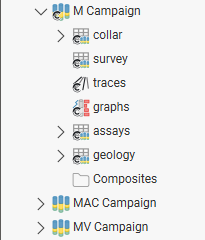
Here there are three drilling datasets, M Campaign, MAC Campaign and MV Campaign:
You can open each table (![]() ) in a drilling dataset by double-clicking on it. The table will be displayed and you can make changes in it, as described in the Working With Data Tables topic. When there are errors in the data, the relevant table will be marked with a red exclamation mark (
) in a drilling dataset by double-clicking on it. The table will be displayed and you can make changes in it, as described in the Working With Data Tables topic. When there are errors in the data, the relevant table will be marked with a red exclamation mark (![]() ). See Correcting Data Errors in Leapfrog Geo for more information on fixing drilling data errors.
). See Correcting Data Errors in Leapfrog Geo for more information on fixing drilling data errors.
In addition to the imported tables, each drilling dataset has two objects that help in visualising and analysing the data. These are:
- The traces object. See Displaying Drillhole Traces.
- The graphs object. See Displaying Drillhole Graphs.
Individual drilling data tables can be deleted. However, the collar table is referred to by all other tables in a drilling dataset and so deleting the collar table will also delete those dependent tables.
Within a single drilling dataset you can create a merged drilling data table, if you are working with columns in different interval tables in the same drilling dataset. Columns created in Leapfrog Geo can be included in a merged table. See the Merging Drilling Data Tables topic.
If you have data across multiple drilling datasets that you wish to use elsewhere in the project, you can create a combined drilling dataset that contains interval values, downhole points, downhole structural data and screens data from other drilling datasets. See the Combining Drilling Datasets topic.
Viewing Drilling Data Table Statistics
To view statistics on an interval table, right-click on the table in the project tree and select Statistics. The following options are available:
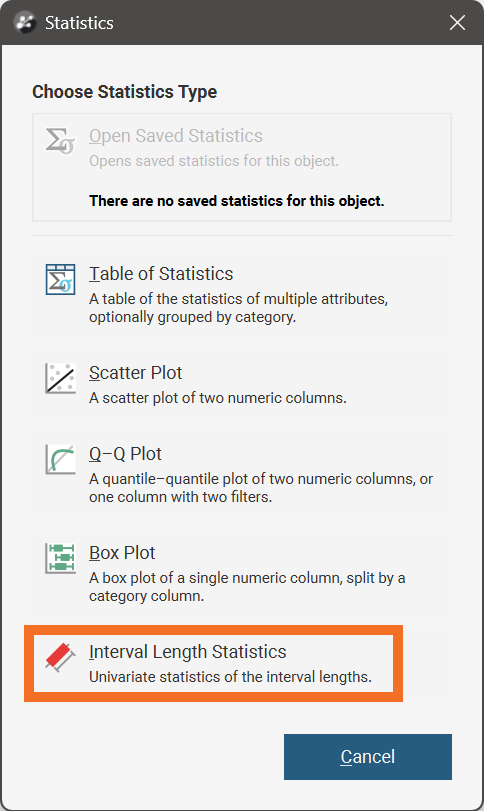
See the Statistics topic for more information on each option:
The Interval Length Statistics graph is a univariate graph, so for more information on the options available, see Univariate Graphs in the Statistics topic.
Right-click on a numeric column and select Statistics to open a univariate graph for that column.