
Importing and Reloading Points Data
Leapfrog Geo imports the following file types for points data:
- CSV Text Files (*.csv)
- ASCII Text Files (*.asc)
- DXF Files (11/12 [AC1009]) (*.dxf)
- Leapfrog Geo 3D Point Data files (*.pl3, *.ara)
- XYZ Text Files (*.xyz)
Points data can be imported from:
- Files stored on your computer or a network location. Right-click on the Points folder and select Import Points > Local. You will be prompted to select a file.
- From any database that runs an ODBC interface. Right-click on the Points folder and select Import Points > ODBC. See Selecting the ODBC Data Source below.
For each of these options, once the data source is selected, the process of importing the data is the same.
Leapfrog Geo expects East (X), North (Y) and Elev (Z) columns.
You can also import a holeID column, although this is optional.
When importing a file that has multiple features, you will be prompted to select which ones to import. You can also choose to:
- Import the features as separate objects. Each feature will appear in the project tree as a separate object.
- Flatten all features into one object. Leapfrog Geo will treat all features as a single object.
Once imported, the file will be added to the Points folder. If there are errors in the data, the errors can be corrected as described in Identifying and Correcting Data Errors in Leapfrog Geo.
To view the imported data, double-click on the object that has been added to the Points folder.
Once points data has been imported to the project, it can be modified and evaluated against geological models, numeric models and estimators, as described in Evaluating Points Data.
Selecting the ODBC Data Source
When importing points data from an ODBC database, you will need to specify the ODBC data source. Enter the information supplied by your database administrator and click OK.
Once the data source is selected, the import process is similar to that described above.
Importing Time Dependent Points
Importing time-dependent points requires the Leapfrog Edge extension.
Leapfrog Geo imports time-dependent points in CSV format. To do this, right-click on the Points folder and select Import Time Dependent Points. Leapfrog Geo will ask you to specify the file location. Click Open to import the file. Leapfrog Geo will display the data and you can select which columns to import.
Leapfrog Geo expects East (X), North (Y) and Elev (Z) columns.
Click Finish to import the file, which will appear in the Points folder.
Time-dependent points can be filtered in the scene by another numeric column, e.g. a time or date column. This enables, for example, micro-seismic data to be visualised over time using a range slider. To view data in this way, click on the points table in the shape list, then select a time or date column as the Display filter in the properties panel:
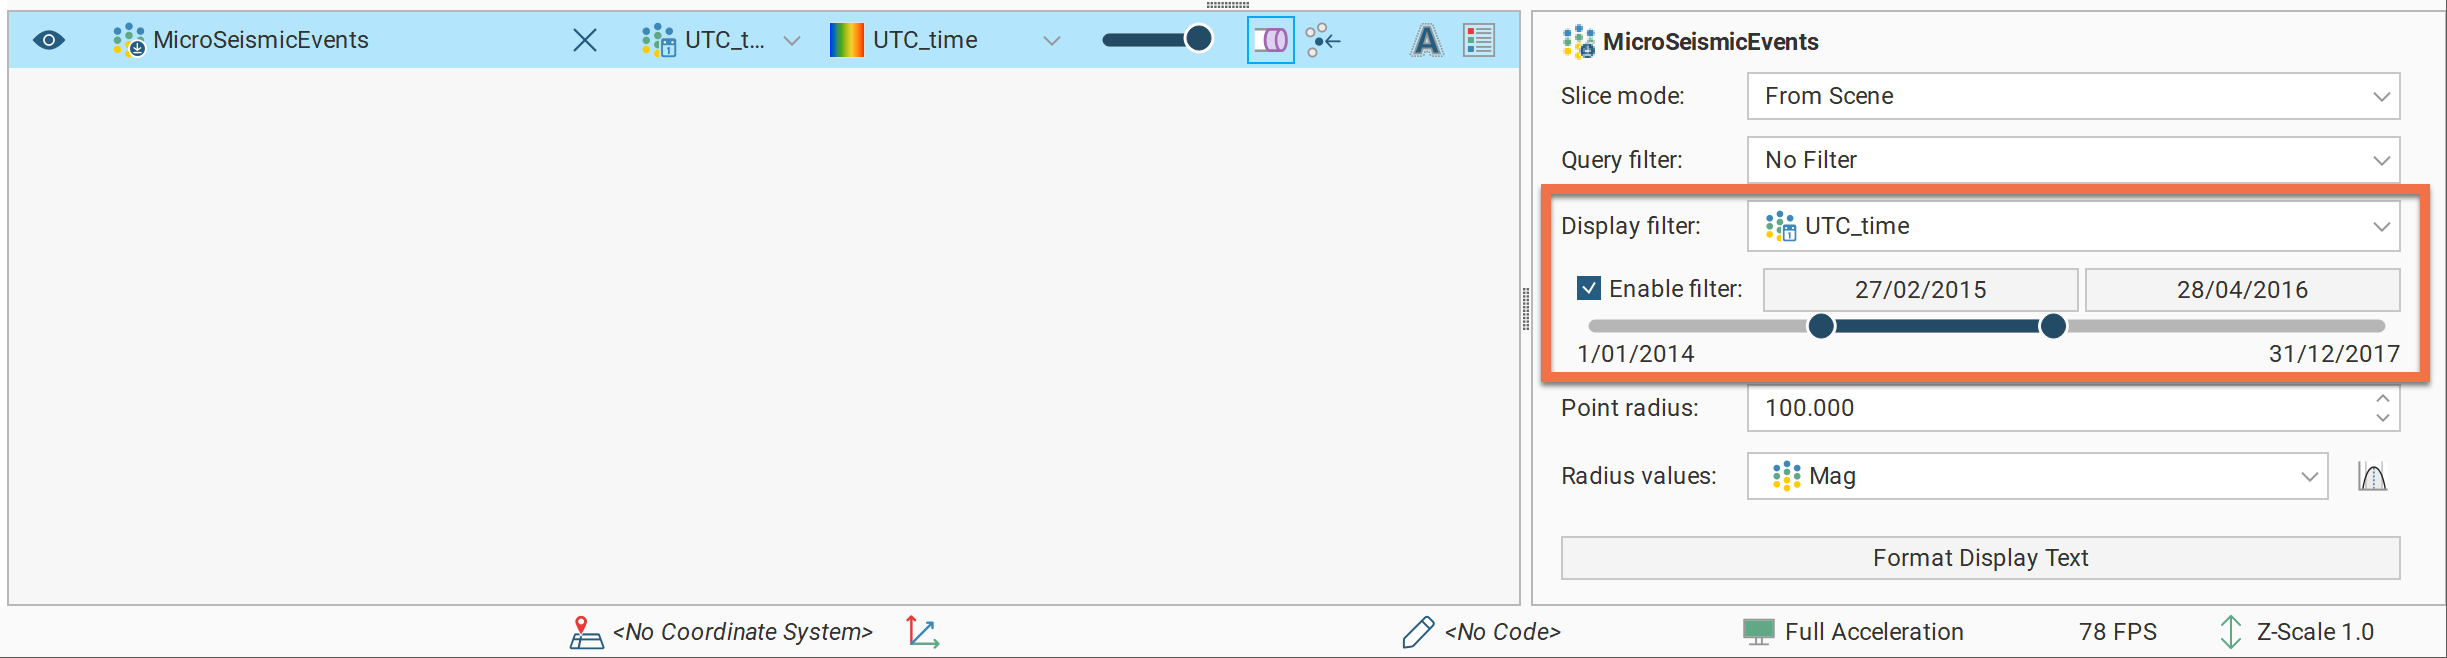
Next tick Enable filter and either click the date buttons to set the upper and lower limits or use buttons on either end of the slider.
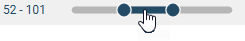
Range sliders have two modes: coarse control and fine control. Here a range slider is used for a set of values that ranges from 1 to 160; it is displayed in dark blue, to show the full range of values in coarse control mode:

You can restrict the data displayed by dragging on the handles. Here the range of values is restricted to 1 to 50:

You can click and drag on the selected range to change the values displayed:
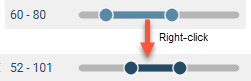
To switch to fine control, double-click anywhere along the range slider. Here the range of 52-101 has been expanded along the whole slider, giving you more control over the position of the range end points:
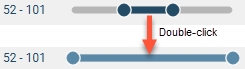
The slider is displayed in light blue in fine control mode.
Now you can use the handles to further restrict the range displayed:
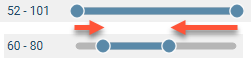
Right-click on the slider to return to coarse control and the full range of values. Here, right-clicking reverts to coarse control, with the range restricted to the original range of 52-101:
Reloading Points Data
Reloading data is necessary when the imported data is modified externally. Points data can be reloaded by right-clicking on the table and selecting Reload Data.
Reloading points data overwrites all data in the existing table. If you have data you wish to add to the project without overwriting existing data, use the Append Data option.
The process is similar to that for importing the original table.
Appending Points Data
If points data is stored in multiple files, you can import these files into the project and add them to existing points data. To do this, right-click on the object you wish to append and select Append Data. You will be prompted to select a file.
Next, the Import Tables For Appending window will be displayed.
Check the data to ensure that the correct information will be imported, then click Finish to add the new file.
See Adding New Rows to Existing Data Tables in the Updating Tables Topic for more information.
Importing a Column
Columns of points data that were not imported when the original data was imported or that are stored in a separate file can be added to the table at any time. To do this, right-click on the points table in the project tree and select Import Column.
The process is similar to importing the original table; select the file and map the columns you wish to import.