Displaying Points
Points data can be displayed using a single flat colour, using a colour gradient (see Colourmaps and Colour Gradients) or using the points values. You can also import a colourmap, which is described in Colourmap Import.
As with drillholes, points data can be displayed as flat points or as spheres. When Make points solid button (![]() ) is enabled for points data, the data points are displayed as spheres. Here, the values are displayed as flat points:
) is enabled for points data, the data points are displayed as spheres. Here, the values are displayed as flat points:
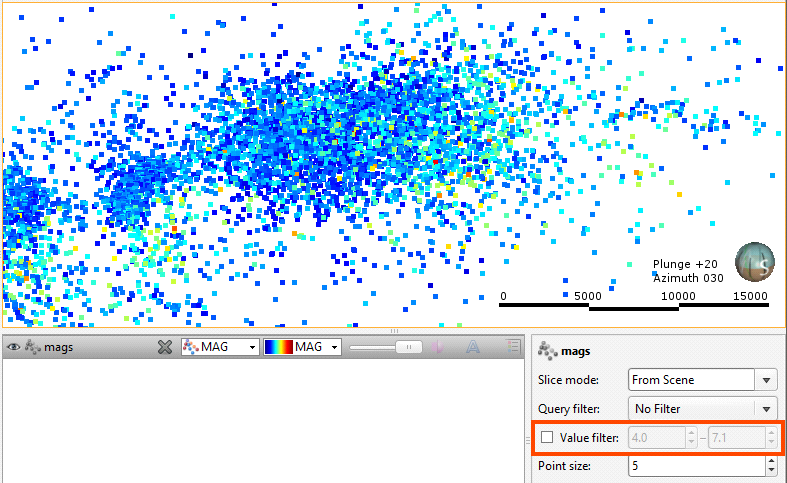
You can restrict the range of values displayed using the Value filter in the properties panel.
When using the spheres option (![]() ), the points can be displayed using the values. To do this, the Radius values list displays the columns available:
), the points can be displayed using the values. To do this, the Radius values list displays the columns available:
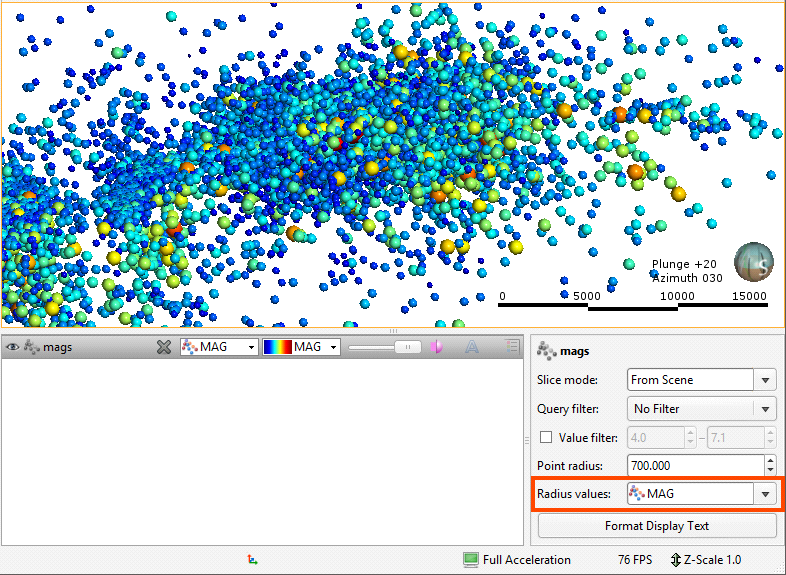
Select the column that will be used to determine the point size.
The Point radius control then determines the maximum point size displayed in the scene.