
Using Imago Image Analysis
Image Analysis features are only available if you have Image Analysis added to your Imago instance.
Imago's Image Analysis uses machine learning to convert core tray images into quantitative, interval-based datasets for RQD, fracture counts and colour intervals. This can greatly improve the speed and consistency of logging.
While Image Analysis assists with the interpretation of downhole imagery, it remains up to the reviewing geologist to validate the results against the actual core imagery, adjust key inputs and re-run outputs before committing the results to record. Image Analysis has been designed to recognise that human interpretation takes priority over algorithmic interpretation. Edits you make to results are regarded as more authoritative than the initial analysis and will be factored into subsequent analyses.
With Image Analysis, there are three types of analyses you can run:
- Image preparation. This is the initial step that standardises the images by cropping or linearizing imagery and producing depth maps of the core tray imagery. This step is required before any further analyses are carried out.
- Geotech. This analysis produces outputs used for geotechnical logging and includes RQD, fracture count, percentage solid and core condition detection.
- Colour. This analysis produces dominant colour intervals for downhole collections.
This guide describes how to use Imago’s Image Analysis. It is divided into:
- Running Image Analysis
- Displaying and Reviewing Results
- Viewing the Attribute Tables
- Editing the Results
- Exporting Results
Running Image Analysis
There are two main stages of Image Analysis: running and reviewing. They can be repeated as many times as needed. This section covers the initial run of an image analysis and describes the inputs required for the run.
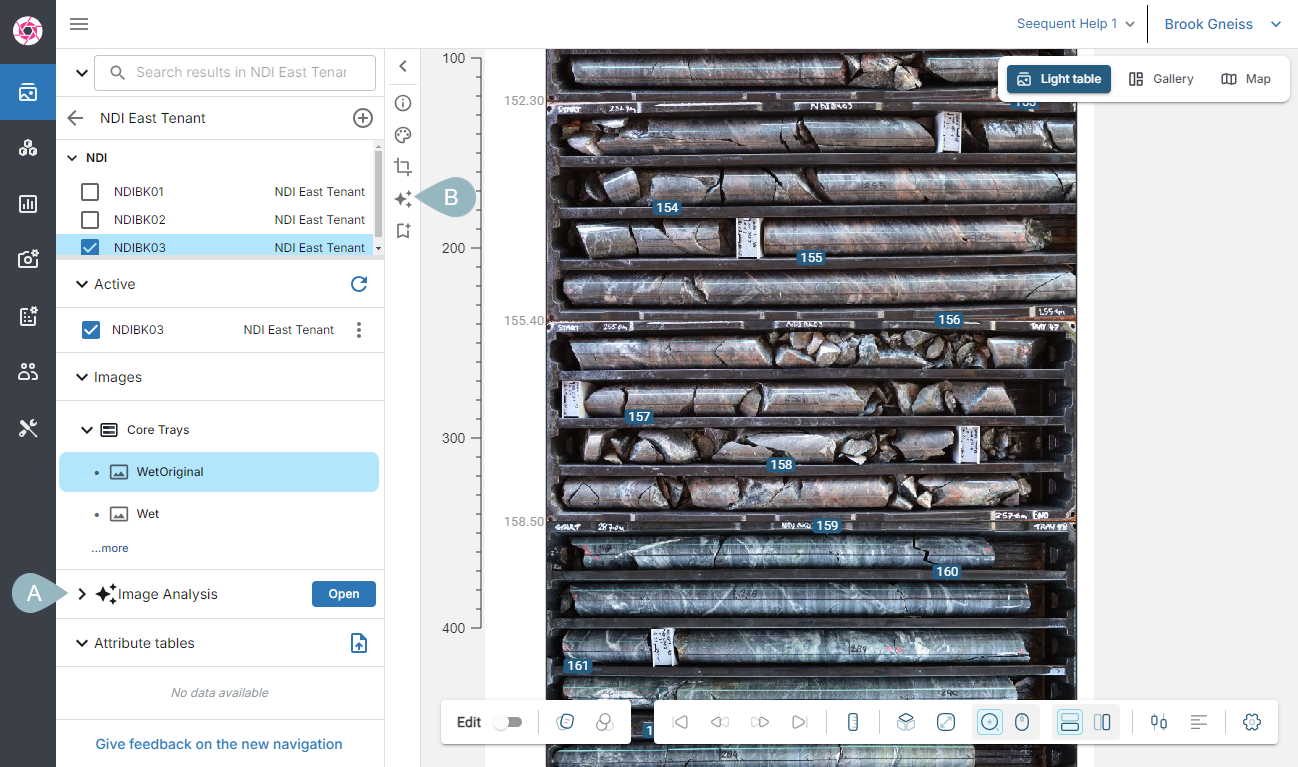
To begin an image analysis, display an original or uncropped core tray collection on the light table and open Image Analysis from the imagery panel (A) or from the image toolbar (B):
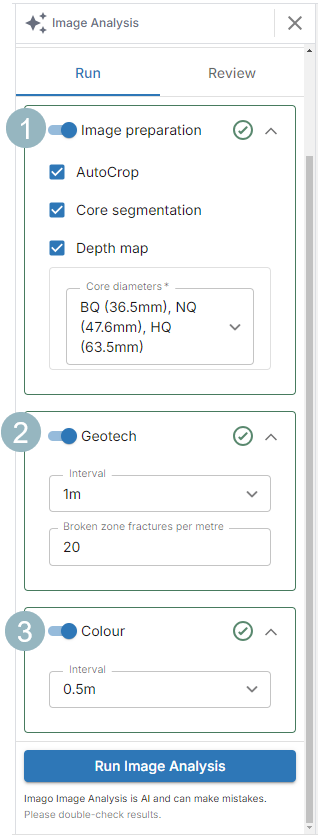
Inputs for Running an Image Analysis
For the first run of Image preparation select:
- All three AutoCrop, Core segmentation and Depth map tasks. Trying to run an image analysis without selecting all three will result in an error.
- At least one Core diameter. Up to three core diameters can be selected.
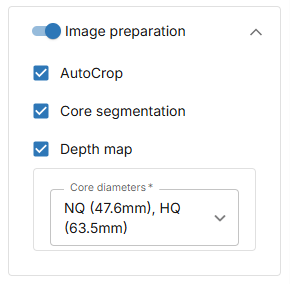
Running the Image preparation task is a required, initial step before running any other image analyses. It prepares the images for the Geotech and Colour tasks.
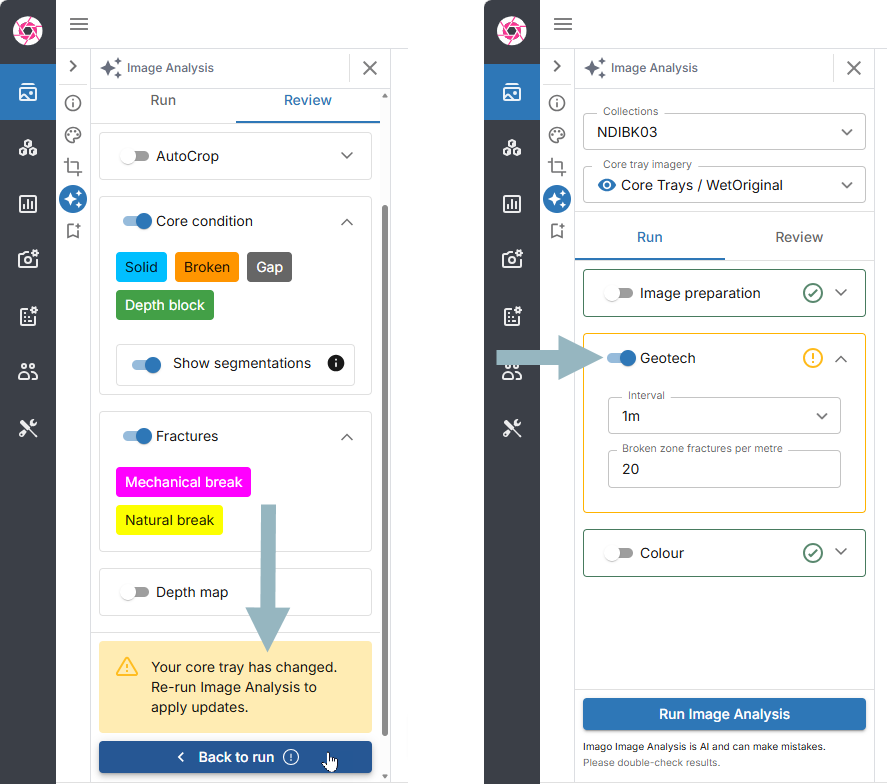
For the Geotech and Colour tasks:
- Select an Interval from 1 to 3 meters, or choose to have the interval at each depth block.
- Specify the Broken zone fractures per metre. This Informs Imago how to handle a zone of rubble.
- Select either 0.5 or 1m for the colour intervals.
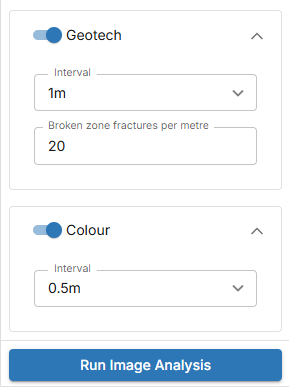
Select Run Image Analysis to begin the analysis.
Displaying and Reviewing Results
Image Analysis results are initially displayed with editing disabled in order to allow you to inspect the results without inadvertently making changes. Editing results is discussed in Editing the Results below.
Once Image Analysis has run, you can validate the results visually, make adjustments and re-run the analysis, if needed. To begin, switch to the Review tab on the Image Analysis panel and use the controls to see the results.
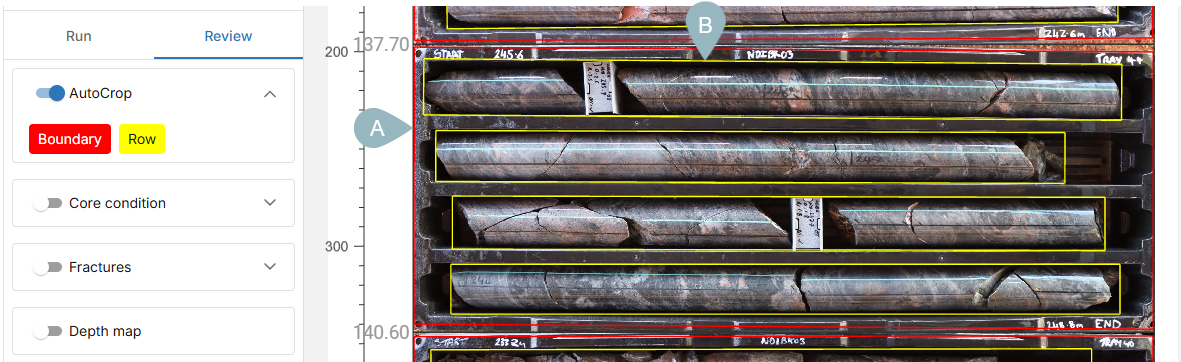
AutoCrop produces Boundary (A) and Row (B) boxes:
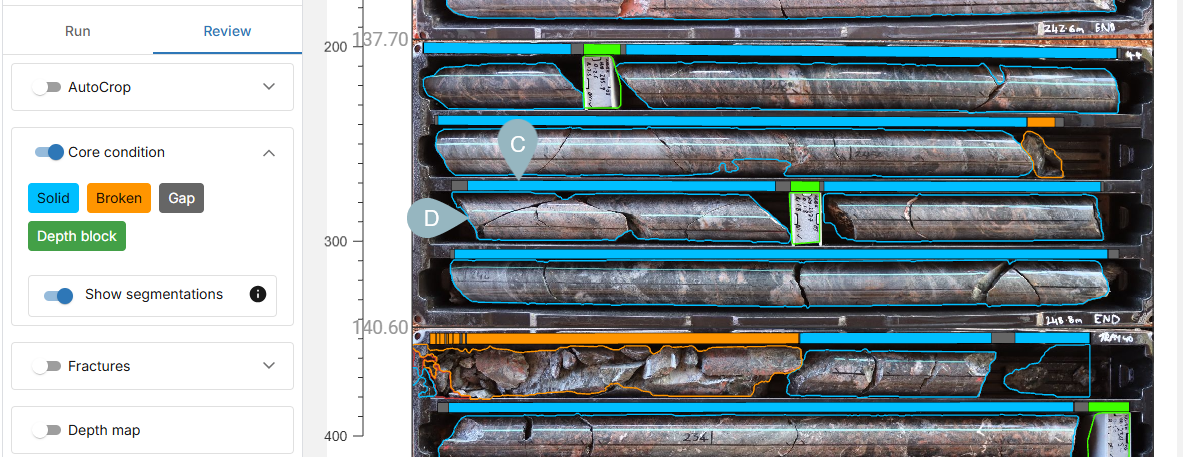
The Core condition is displayed as a coloured line (C) above each tray row representing Solid, Broken, Gap and Depth block conditions.
You can enable Show segmentations to see the core with detailed polygons (D) around each different core condition. This helps with seeing where the core condition is derived from.
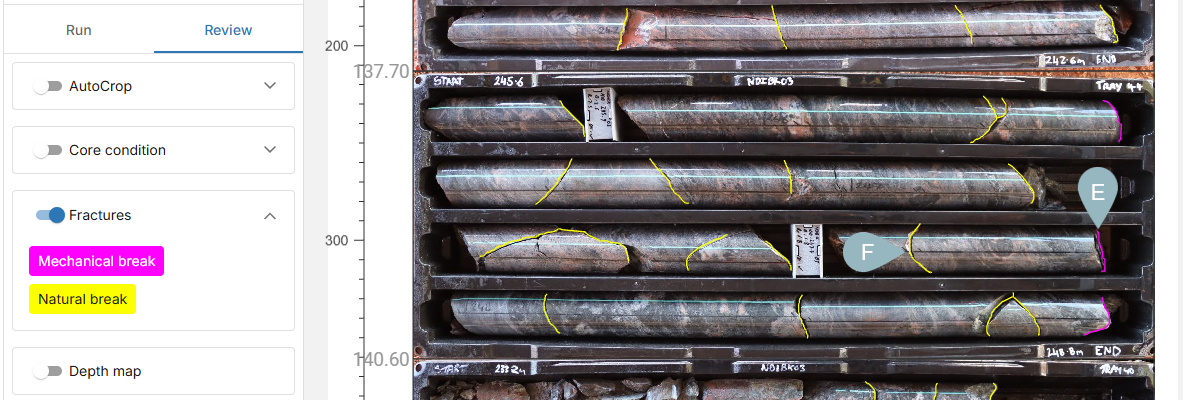
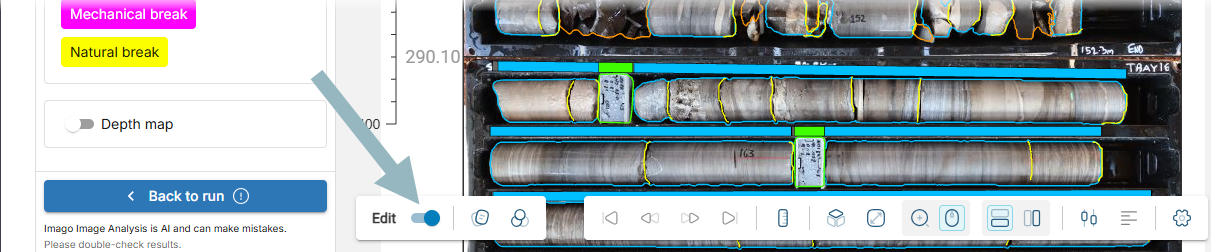
Fractures are shown as pink polylines for a Mechanical break (E) and yellow polylines for a Natural break (F). These represent discontinuities or breaks in the core.
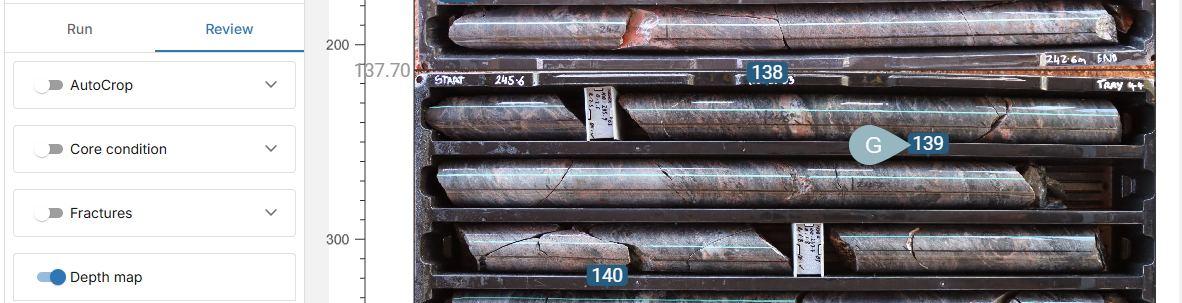
The Depth map setting is for enablling the display of depth markers (G) and for changing the depth marker positions.
Viewing the Attribute Tables
An image analysis also generates attribute tables that can be displayed as on the light table as columns.
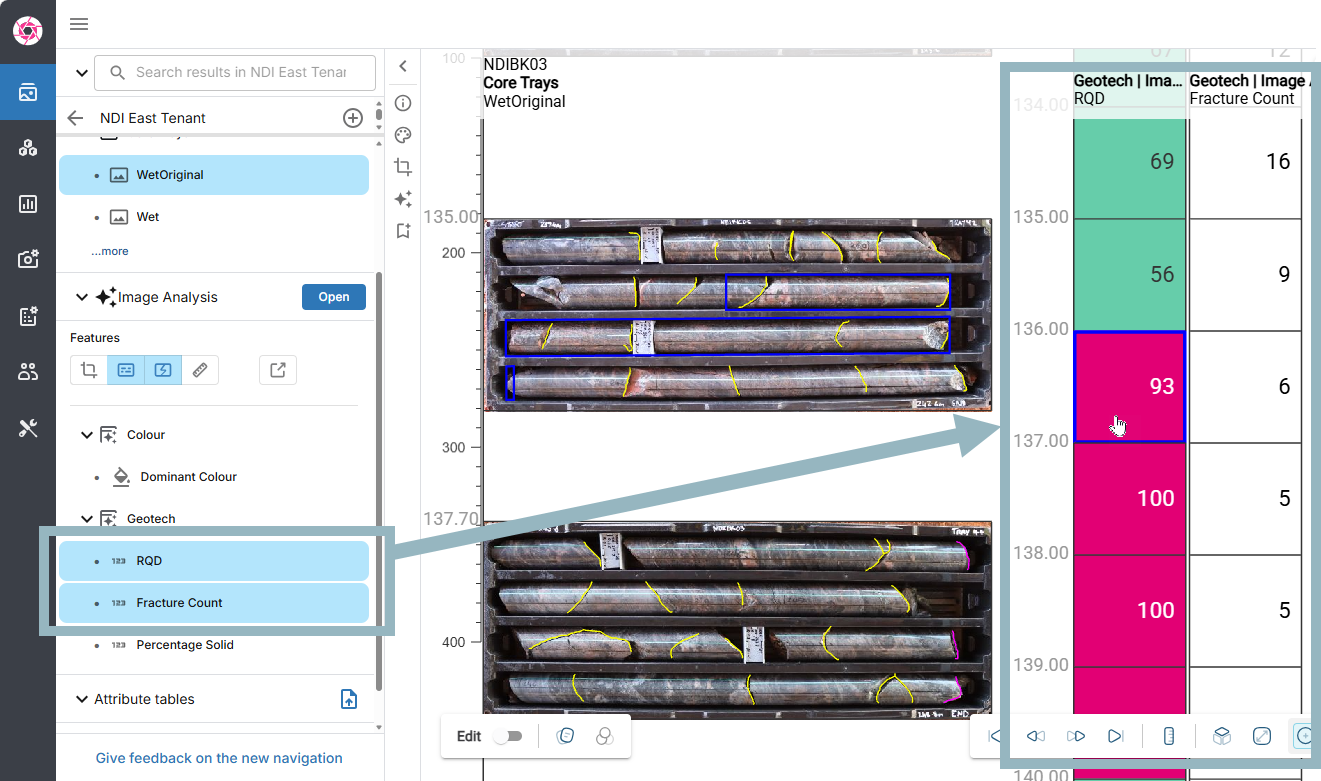
In the Image Analysis part of the imagery panel, click on the columns to display them. This adds them to the light table alongside any images already on the table. Click on an interval to highlight the corresponding section on the core tray. Here, the RQD and Fracture Count columns are displayed with an interval highlighted:
The attributes generated are:
- A Colour table with an interval-based, dominant colour column
- A Geotech table with the following columns:
RQD. This is the sum of length of Imago measured solid core segments more than 10 cm divided by the interval length, then multiplied by 100.
Fracture count. This is the count of natural fractures found in solid core segments for the interval. If an interval is made up of fragmented segments, fractures won't be counted.
Percentage solid. This is the proportion of an interval that consists of solid core segments.
Editing the Results
Image Analysis has been designed to recognise that human interpretation takes priority over algorithmic interpretation. Edits you make to results are regarded as more authoritative than the initial analysis and will be factored into subsequent analyses.
Image Analysis results are initially displayed with editing disabled in order to allow you to inspect the results without inadvertently making changes. When you do make changes, you will be prompted to re-run Image Analysis. Go back to the Run tab and select the highlighted task where a change was made.
Once you are ready to make changes, you can enable editing using the switch at the bottom of the window:
Changes you make in Edit mode are automatically saved and cannot be undone.
Polygon types that can be edited are:
- Linearisations
- Core markings that have been added through the features menu
- Fractures
To edit a polygon, click on it to display its points and move a point to a new position. After adding the last point, right-click to end the polyline.
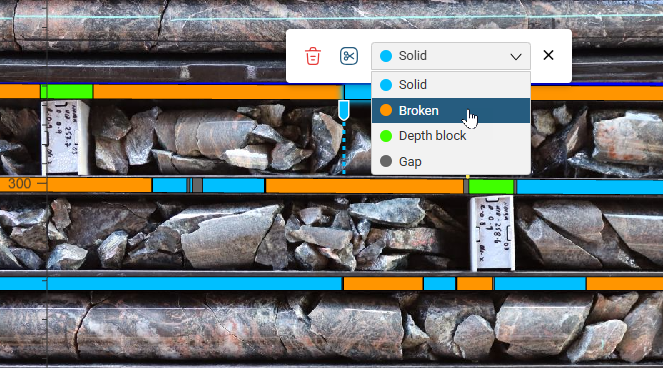
To reclassify a Core condition, click on the colour bar above the core and select the new core condition:
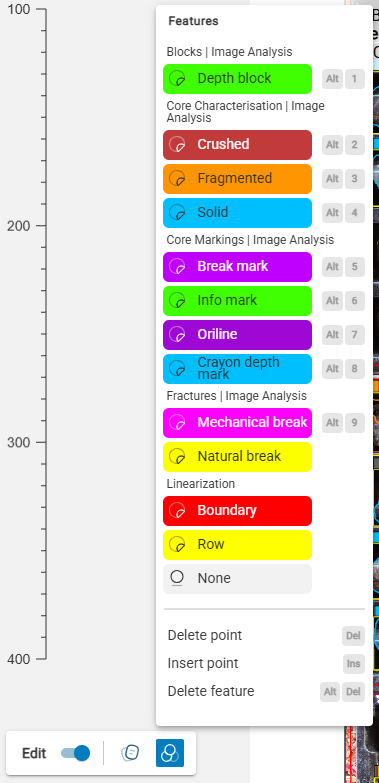
To add a feature, open the Features menu from the Edit toolbar and select a feature to insert. From the features menu you can:
- Add a Depth block polygon
- Reclassify Core Characterisation sections
- Add a polygon for Core Markings such as info marks and orilines
- Add a Fracture polygon
- Add a Boundary or Row polygon
- Delete or insert a point
- Delete a feature
What features are available in the features menu depends on which Image Analysis results are enabled in the Image Analysis panel.
To add depth markers, click on the core and enter a depth. A marker will be added at that location. Depth markers can also be edited by clicking on them and entering a new depth. You can also drag the marker below the number to a new position.
After an edit is made, you will be prompted to re-run Image Analysis. Click on the Run tab and click on the task that was changed, which will be highlighted.
Click Run Image Analysis to run the process again.
Exporting Results
Exporting Image Analysis outputs requires the Imago Connect application.
Visit MySeequent for the latest version of Imago Connect.
Once you have downloaded and installed Image Connect, launch the application and sign in.
To export Image Analysis results, click on Image Analysis in the sidebar. Next, specify the workspace, dataset, collection and table to export. Leaving an asterisk will download all items available. For example, this configuration will result in all tables in the NDIBK03 collection being downloaded:
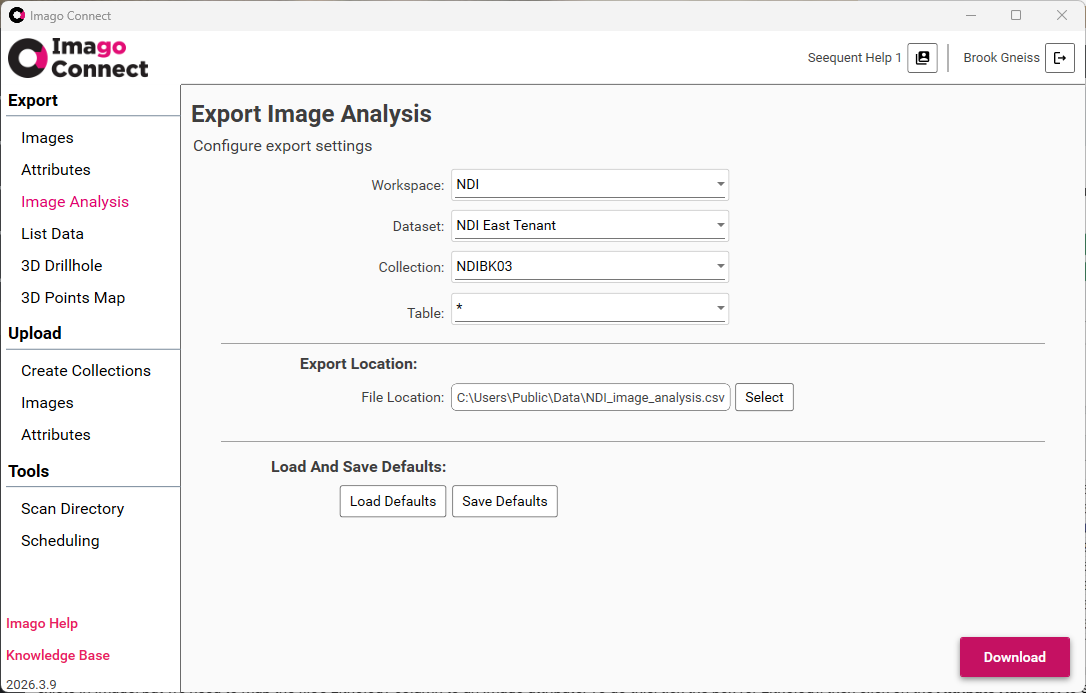
Choose an Export Location and click Download.
Got a question? Visit the Seequent forums or Seequent support
© 2025 Seequent, The Bentley Subsurface Company