Plot a TIN Mesh
Use the Grid and Image > Gridding > Tinning > Plot a TIN Mesh menu option (TINMESH GX) to plot a Triangular Irregular Network (TIN) mesh.
Plot a TIN Mesh dialog options
Application Notes
Delaunay triangulation (Tin mesh)
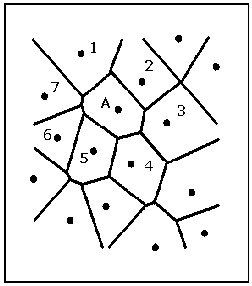
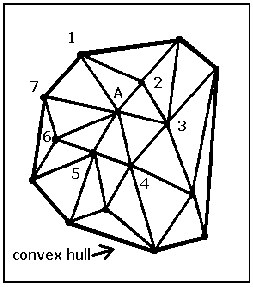
The Delaunay triangulation is the set of triangles formed out of the connections between nodes in the TIN, determined by the TIN algorithm. The Delaunay triangulation (Tin mesh) of the 16 nodes in Figure 1, is shown in Figure 2. Simply connecting the nodes of the Voronoi cells that have common boundaries forms the Delaunay triangles. In effect, the Voronoi cells and Delaunay triangles are "different sides of the same coin", and, mathematically, either can be derived from the other.
|
|
|
|
Figure 1: The Voronoi diagram for a set of 16 nodes in a plane |
Figure 2: The corresponding Delaunay triangulation (tin mesh) of Figure 1. |
Delaunay triangles are the set of least ‘long and thin’ triangles that can be generated among the many triangulations that are possible with irregularly distributed points. This is referred to as the maximum – minimum angle property and can be used as the basis for calculating the set of triangles (Fortune 1992).
Another useful property, the size of the Delaunay triangles, is strongly determined by the density of the nodal distribution. This property is derived directly from the Voronoi cells, whose area can be used as an inverse measure of the nodal density. The size of the Delaunay triangles will vary enormously when the nodal distribution is highly irregular.
The combined properties of the maximum-minimum internal angle and density-dependent size make Delaunay triangles ideal for use as the basis of an interpolation procedure.
The TINMESH GX plots the Dealunay triangles.
See Also:
Got a question? Visit the Seequent forums or Seequent support
© 2023 Seequent, The Bentley Subsurface Company
Privacy | Terms of Use


