
New Map from X,Y - Data Range to Map
Use the Map > New menu option or the Map Tools > New Map from > X, Y menu option, (NEWMAP GX), to create a new blank map to fit the data range specified. The data range can be entered manually, or it can be determined from the range of selected projected data in a database or from the area covered by a grid with a projected coordinate system.
Data Range to Map dialog options
|
Minimum X Minimum Y |
Specify the coordinates of the bottom left ground data point to be mapped. |
|
Maximum X Maximum Y |
Specify the coordinates of the top right ground data point to be mapped. |
|
Distance unit |
Select the native ground distance units for the map. |
|
Coordinate System |
Displays the current projected coordinate system. |
|
[Scan data] |
This will scan the projected X and Y channels of the selected database to determine the data range. If the projection is rotated, you have the option to plot the map in the local coordinate system (not rotated) or in the rotated orientation (See illustrations). |
|
[Scan grid] |
This will scan the dimensions of a grid file to determine the data range and distance units. If the projection is rotated, you have the option to plot the map in the local coordinate system (not rotated) or in the rotated orientation (See illustrations). |
|
[Interactive] |
Select the range interactively by defining a rectangular area on the selected map with the mouse. |
|
[Coordinate System] |
Display the map projection for the data view in the new map, and modify if necessary. |
|
[Next>] |
Click the Next button to open the New Map dialog and create a map based on the X,Y data range specified. |
Application Notes
If the scanned data or grid file does not have an established unit, "metres" is assumed.
It is important that the distance units accurately reflect the units of the data range.
If a database, grid file, or map are scanned using the "Scan data", "Scan grid", or "Interactive" buttons, the new map's projection is set to the projection of the scanned item. If the scanned projection contains a warp, the warp is removed for the new map's projection. This allows the map projection to be in a true projection and the data will be warped when it is displayed on the map.
If the projection of the scanned data is rotated, you will be prompted to plot the map in either the local coordinate system (Fig. 1 - unrotated) or in the rotated (Fig. 2) orientation.
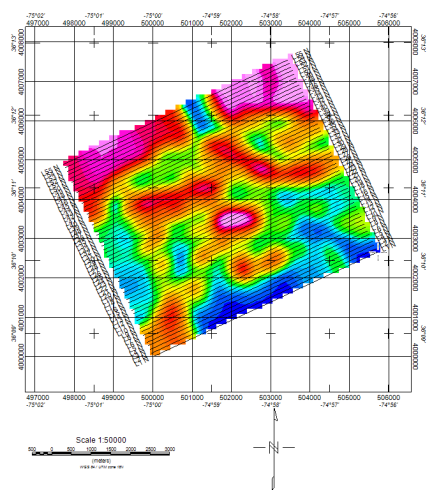
Fig. 1 - Unrotated map. North is along the Y axis.
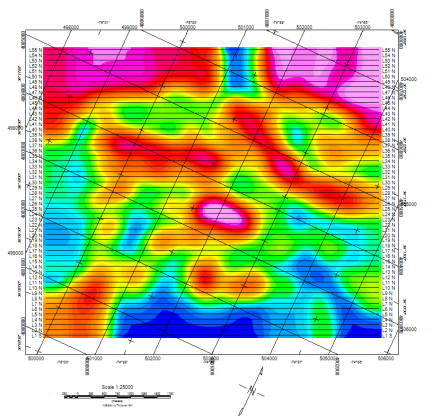
Fig. 2 - The projection rotation is taken into account. North arrow aligns with the rotation.
See Also:
Got a question? Visit the Seequent forums or Seequent support
© 2023 Seequent, The Bentley Subsurface Company
Privacy | Terms of Use