
Digitizing Geological Interpretations on Section Maps
This document provides a description of the workflow to digitize geological interpretations on drillhole section and plan maps. Using a combination of real data plotted on the map and expert knowledge, geologists can use their expertise to draw interpretations on drillhole maps. The 2D interpretations for all the features on all the section maps can be saved to the same geostring file. The single file solution makes it easy to manage the interpretations and to share your work with others. The interpretations can later be joined to create 3D surfaces.
Any edits made to the interpretations on your section maps will automatically be updated in the 3D Viewer.
This page guides you through:
-
creating a new geostring file.
-
adding features to the geostring file.
-
digitizing geological interpretations.
-
editing interpretations.
-
deleting interpretations.
-
changing the properties of an interpretation.
-
viewing a summary of the interpretations in a geostring.
-
visualizing the geostring in the 3D Viewer.
Section Maps with Downhole Data
Before you begin digitizing geological interpretations that will be joined into a wireframe, you must first create a series of section maps for your drillhole project. When creating the section maps, specify the downhole data to plot that you will use as a guide when digitizing your interpretations on the map. After you have created your section maps, create a geostring file and use the Geostrings Toolbar to digitize interpretations, and manage the features and interpretations in the geostring file.
When creating the drillhole maps, plot the downhole data from composite databases to simplify digitizing and snapping.
If you are plotting downhole lithology, you may also want to use Post text or Text bands from the Data tab. Offset from the rock patterns, these items can be used to highlight lithologies of interest.
Decreasing the distance between section maps and trying to position the holes as close to the centre of the section as possible will allow you to create more accurate interpretations and wireframes.
Geostrings Toolbar
The Geostrings Toolbar drives the digitizing workflow for drawing interpretations on your section maps. The toolbar is displayed within the map window when you create or open an existing geostring from one of the following menus: Map Tools, Section Tools, or DH-Plot menu.

Geostring Files
Geosoft geostrings are 3D vector files that store digitized interpretations drawn on section maps. Both polygon and polyline features can be stored in the same file.
Geostrings store the following information:
-
XYZ locations
-
Coordinate system
-
Attributes including feature names and symbology
The Coordinate system for your geostring file will automatically be set based on the current Target drillhole project. It is recommended that you set the Coordinate system for your drillhole project before you create your section maps, geostring file and any other output from your project. The Coordinate system for a drillhole project is set through DH-Data | Coordinate System.
Create a geostring file:
-
From one of the available menus, select New Geostring.
-
Enter a Geostring name.
Add a feature to a Geostring file:
-
In the New Geostring for Geological Feature Interpretations dialog box, to the right of Features to digitize, click Add new feature
 .
. -
Enter a Name.
-
Select the display Colour for the Feature (this can be changed later).
-
The Digitization Type Polygon is selected by default. Change it to Polyline if required. Wireframing polygons will create a closed body (ore body, lithology body, etc...). Wireframing polylines will create an open surface (fault, vein, etc...)
-
You can optionally enter a Description for the Feature.
-
Click Add.
-
Continue adding as many Features as you require for your project to the geostring file. A geostring file can store many polygon and polyline features.
-
Click OK on the New Geostring for Geological Feature Interpretations dialog.
If you need to change the Name, colour, digitization type or description for a feature that you added to the geostring file, select the Feature to digitize in the New Geostring for Geological Feature Interpretations dialog and click Edit selected feature.
If you are returning to a project and would like to continue digitizing and managing interpretations in an existing geostring, select Open Geostring from one of the available menus. The interpretations in the geostring will automatically display on the section maps they were drawn on.
To digitize geological interpretations:
-
Display one of the open section maps so it appears in front of any other open windows in the project.
-
On the Geostrings Toolbar, select the Feature you want to digitize an interpretation of.
-
If Toggle Snapping is turned on (the snapping icon will appear active on the Geostrings Toolbar), select an item to Snap To. You can snap to True Drillhole Locations or Projected Map Groups or Geostring Features. You can Toggle Snapping off if you prefer to digitize without it.
-
On the Geostrings Toolbar, click Digitize Interpretations.
-
If Snapping is on, hover the mouse over different parts of the section and observe how it changes when it comes to within 10x10 pixels of the specified Snap To item.
-
Use the left mouse button to add vertices for the polygon or polyline feature.
-
To end the interpretation (i.e. to close the polygon or end the polyline), right-click | Done.
-
Use steps 1 – 7 to digitize geological features on your other section maps. You can easily switch between section maps by double-clicking a map listed under the Project Explorer.
While digitizing, you can use the Undo/Redo options from the right-click context menu, or use the Ctrl+Z or Ctrl+Y shortcut keys, respectively.
To pan and zoom while digitizing, right-click on the map and select an option from the context menu, or use the assigned shortcut keys for each function that are listed in the context menu (i.e. "P" for Pan and "Z" for Zoom In).
Don't double-click to end the polyline or polygon as this adds two vertices at or near the very same location.
Digitizing more points will create smoother interpretations which will also create smoother wireframe surfaces once the 2D interpretations are joined into 3D surfaces.
If you recreate a section map or replot the holes on a section map, the interpretations in the geostring file will remain visible on the map.
In Oasis montaj and Target, an open geostring is displayed in the open section maps. When the Geostring interpretations are closed they are no longer displayed in the map. If the geostring is open, but the Target Project databases are not open, then the option to snap to true drillhole location cannot be used.
Snapping
While digitizing, if snapping is enabled, you can snap to the true drillhole locations, to a projected map group, or to an existing geostring feature.
True Drillhole Locations
-
The cursor will snap to the true X, Y, Z location along the drillhole trace for the from or to intervals in the specified drillhole database.
-
If you allow the snapping cursor to remain still at a location, a tooltip will show the database being snapped to, the distance away from the centre plane of the section and the true X, Y, Z position at that position.
Projected Map Groups
-
The cursor will snap to the X, Y, Z location of the specified map group projected onto the centre plane of the section. Only vector groups can be selected, not grid groups.
-
If you allow the snapping cursor to remain still at a location, a tooltip will show the map group being snapped to and the X, Y, Z position of the section plane at that location.
Geostring Features
-
The cursor will snap to the X, Y, Z location of the specified geostring feature.
-
If you allow the snapping cursor to remain still at a location, a tooltip will show the geostring feature being snapped to, whether a vertex or edge is selected, and the X, Y, Z position of the feature at that location.
Manage Geostring
The Manage Geostring option  on the Geostrings Toolbar allows you to add features, import existing features from another geostring, edit existing features (change the name, colour and description) and delete features for a geostring file.
To edit geological interpretations:
-
Open the geostring file to be edited by selecting Open Geostring from one of the available menus.
-
Click Select Interpretations
 from the Geostrings Toolbar.
 -
Select the geostring feature (polyline or polygon) to be edited.
-
Click Edit Vertices...
 from the Geostrings Toolbar. The vertices are now highlighted by square symbols on the map. Points on the section plane are white squares; points off the plane of the section will appear pink.
 -
Use the mouse to move existing vertices.
-
To add new vertices, click Add Vertices...
 from the Geostrings Toolbar (this is also available in the right mouse button menu) then add new vertices between existing vertices.
 -
To delete vertices, click Delete Vertices...
 from the Geostrings Toolbar (this is also available in the right mouse button menu) then select the vertices to be deleted.
 -
Vertices can be added or removed from polygons by using the plus ( + ) and minus ( - ) keys on your Number Keypad.
The plus ( + ) and minus ( - ) keys on the main alpha-numeric keypad will not work; you must use the Number Keypad only.
While editing vertices, you can use the Undo/Redo shortcut keys (Ctrl+Z and Ctrl+Y, respectively).
The edit vertices options can also be found in the context menu if you right-click on the section map.
Delete an interpretation:
-
Click Select Interpretations
from the Geostrings Toolbar. -
Click on an interpreted shape on the section map to select it. Once selected, it will be bounded in cyan.
-
Click Delete
 on the Geostrings Toolbar.
If an interpretation is edited or deleted, the wireframing history for the feature will not be deleted. Deleted interpretations will simply no longer be included in the wireframe. Edited vertices will update the wireframe accordingly.
Change the properties for an interpretation:
If you digitize an interpretation on the section map but realize that it was added to the wrong feature, you can reassign the interpretation to the correct feature.
-
Click Select Interpretations
from the Geostrings Toolbar. -
Click on an interpreted shape on the section map to select it. Once selected, it will be bounded in cyan.
-
Click Interpretation Properties
 on the Geostrings Toolbar.
 -
Select the correct Feature for the interpretation and click Save.
View the Geostring Table:
The Geostring Table is a summarized list of section maps and features with interpretations.
-
Click the Geostring Table option from the Geostrings Toolbar. The table displays the section maps that have geological interpretations. Location information is also presented for each map. The number of interpretations per Feature is shown for each drillhole map.
-
Click Close when you have finished viewing the information in the table.
-
You can double-click a row in the Geostring Table to open the map.
The Delete button
 will delete all the interpretations for all the features for the selected section map. Any wireframing progress for those features will also be removed from the geostring. This operation cannot be undone.
If you see a row in the Geostring Table highlighted in pink, this indicates that the section map cannot be found because it was either moved or renamed. Select the row and use the Find missing map button
 to browse to and select the missing map.
View the Geostring in the 3D Viewer:
-
Open the 3D Viewer for an existing 3D map or to create a new 3D map, use DH-Plot | 3D Map.
-
From the Add to 3D menu, click Geostring.
-
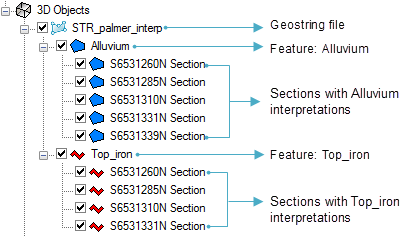
Select the Geostring File and click OK. Your interpretations will display in the 3D Viewer. In the tree list, you will see the geostring as the top layer; your features will be listed below this. Below each feature, the section maps with interpretations for the feature are listed.
-
You can optionally toggle items on or off in the tree list to help you visualize your 3 model.
Got a question? Visit the Seequent forums or Seequent support
© 2023 Seequent, The Bentley Subsurface Company
Privacy | Terms of Use