
Set X, Y, and Z Increments
Use the Set Increments dialog, opened from the Display tab of the Visualization window (available in the 3D, Voxel, and Geosurface Viewers), to set the current view interval parameters for the axes labels.
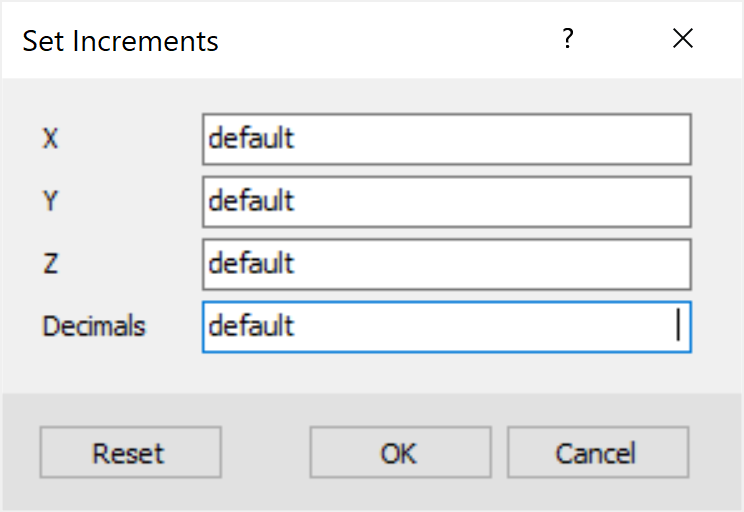
When the dialog is displayed the first time through, the values of X, Y, Z and Decimals are set to "default" (the original values of the current view):
To override the default values, simply click inside any of the text boxes and enter a new value. The corresponding axis interval values will update in real time once you click on another field in the dialog. This allows you to go through an iterative process, while the dialog remains open, in order to obtain just the right increment.
Note that overriding the number of decimals applies to all three axes.
The maximum number of tick marks that can be generated for each axis (calculated based on the minimum/maximum values of the axis) is 20. You will be prompted to specify a higher increment value if the input value will generate more than 20 tick marks.
The new interval values and number of decimals are applied to the current view while the Set Increments dialog remains open. Each modified axis label will be redrawn in the current view with the new increment, and if the new increment is smaller than the default (original) value, the labels font will be adjusted.
Press the Reset button (or leave the input fields empty) to recover the current view original parameters.
Click OK to preserve the changes and return to the Visualization dialog.
The changes are applied to the current view only and do not carry over to other 3D views open in the project window or to exports such as 3D PDF.
Press Cancel to exit the dialog and revert to your previous 3D view settings.
See Also:
Got a question? Visit the Seequent forums or Seequent support
© 2023 Seequent, The Bentley Subsurface Company
Privacy | Terms of Use