
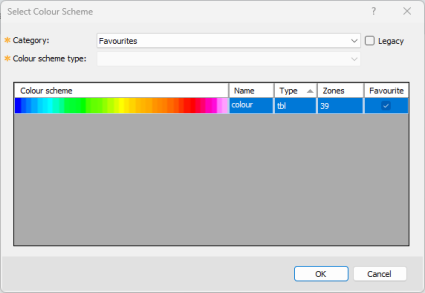
Select Colour Scheme
Use the Select Colour Scheme dialog to visually select the colour scheme for displaying a grid, a voxel, or a data layer/group (i.e., grid (AGG), voxel (data or vector), variable-coloured 2D/3D symbols) in a map or 3D view. The category and colour scheme selection will be retained when the tool is run next time. The dialog can be accessed through the Colour Tool and other dialogs that enable you to select a colour palette.
Select Colour Scheme dialog options
|
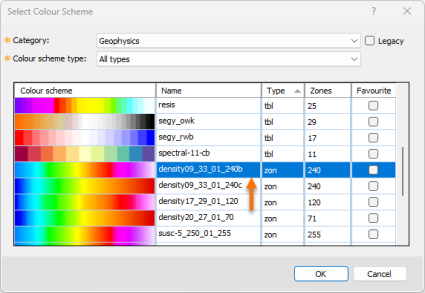
Category |
To circumvent sorting through a long list, the colour schemes have been subdivided into logical categories — see the Application Notes below for a description of each available category. The default selection is the Favourites category; however, if you have previously selected a colour scheme from one of the other categories, the corresponding category will be remembered and selected, and the Colour scheme list will be filtered accordingly. |
|
Legacy |
Check this option to access older colour schemes that were moved out of the Geophysics and Monochromatic categories due to their repetitive nature. The legacy content is located in the "...\Geosoft\Desktop Applications\tbl\legacy" folder: the two subfolders, Geophysics and Monochromatic, contain all the repeated colour schemes. Only the main colour schemes remain in the main colour categories.
|
|
Colour scheme type |
Colour schemes can be one of the types below:
For more information on each file type, see the links in the Application Notes. You can filter the colour scheme selection by the file type:
This is a dynamic list: if a given file type is not present under the currently selected Category, it will be omitted from the list.
|
| Colour scheme |
A general representation of each colour scheme, the colour scheme file name and type, and the number of colour zones are listed for each colour scheme entry. The default colour scheme is set in the General Settings dialog, and it is explicitly made available under the Favourites category. As long as you have not previously selected a different colour scheme, the dialog will open with the default colour scheme selected: To modify the selection, navigate through the colour scheme categories, select a different category and optionally a colour scheme type, and from the list of filtered colour schemes, click on the desired colour scheme entry to select it. Your selection will be retained, and on reopening the tool, your colour scheme and category will be automatically selected. The colour scheme will be remembered as long as it was not substantially changed when editing.
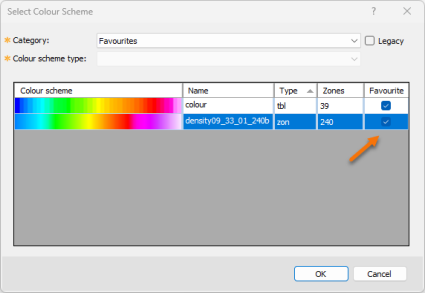
If you want your colour scheme to be easily accessible, simply select the entry and check the Favourite box. Tagging a colour scheme as "favourite" will have it appear under the Favourites category. You can "untag" (uncheck) any colour scheme from the Favourites category, except for the default colour scheme: the colour scheme file defined in the General Settings dialog cannot be removed from the list of favourites. To change the default colour scheme, go to the General Settings dialog. If you would like to reorder the colour schemes by file name, click on the Name heading. Similarly, to reorder the colour schemes by number of zones, click on the heading Zones, and to sort by extension type, click on the Type heading. |
Application Notes
Colour Tables
To help you navigate through the colour schemes more effectively, the installed colour scheme files (e.g., colour tables (*.tbl)
, colour zones (*.zon)
, etc.) are organized in subfolders, each defining a category.
In addition, this tool keeps track of three custom categories, and you are also able to browse outside of the structured categories.
The colour schemes have been subdivided into the following categories:
System Categories
-
Geophysics: contains colour tables appropriate for displaying single-entity geophysical data, such as total magnetic intensity, gravity, resistivity, induced polarization.
-
Topography: contains colour tables that convey the feel of terrain and should be used to display elevation or topography.
-
Monochromatic: Radiometric data is generally displayed as an overlay of three normalized elements on a single colour map; each element is displayed using gradations on a single colour. All monochromatic tables along with shadow tables are found under this category.
-
Heat map: Originally devised for depicting financial information and later to display frequency of web page visits, the schemes found under this category lend themselves well to thematic data display.
-
CET perceptual: The Centre for Exploration Targeting of the School of Earth Sciences at The University of Western Australia has produced a set of perceptual colour schemes that are freely available. For your convenience, we provide them with Oasis montaj.
-
Perceptually uniform: The perceptual contrast of adjacent colours may vary widely for some colour schemes. The result is that in some sections of the colour scheme, the data variation will be less visually noticeable (dead zone) than in other sections, preventing a proper interpretation. Perceptually uniform colour schemes offer the same visual contrast throughout the colour scheme.
-
Miscellaneous: Some specialized Oasis montaj extensions trigger the installation of additional colour schemes. In order to easily find them, these schemes are grouped in a separate category labeled "Miscellaneous". This category will only appear if you actually have such extensions.
Contextual Categories
-
Favourites: The default colour scheme defined in the General Settings dialog (accessed from the menu Project > Settings > General), along with any other schemes that you have tagged as favourite are made available under this category.
To change the default colour scheme, go to the General Settings dialog.The category points to the "%USERPROFILE%\Documents\Geosoft\Desktop Applications\tbl\Favourites" folder. Tagging/untagging a favourite scheme will add/remove the corresponding colour scheme file to/from this folder.
-
My Colour Schemes: You may want to access your custom colour schemes that you have compiled over time. These can be a collection of tables you downloaded from various sources or generated yourself. The category points to the "%USERPROFILE%\Documents\Geosoft\Desktop Applications\tbl" folder, which persists across upgrades.
This category will only appear if you have colour scheme files in the folder noted above. -
Project directory: You may have custom colour schemes specific to your project that you access from your working directory.
This category will only appear if you have colour scheme files in your working folder.
[Browse...]
-
Opens the file selector dialog Browse for Colour Scheme File and defaults to the location of the currently selected colour scheme file.
-
Provides the option to navigate outside the above structure and locate a colour scheme file. Use the buttons listed below to toggle between the following locations:
-
Project Directory: your working folder
-
Standard Colour Schemes: the \tbl folder in your Oasis montaj program directory
-
My Colour Schemes: the \tbl folder in your default user profile directory (i.e., %USERPROFILE%\Documents\Geosoft\Desktop Applications\tbl)
-
Got a question? Visit the Seequent forums or Seequent support
© 2024 Seequent, The Bentley Subsurface Company
Privacy | Terms of Use