
Dynamic Data Linking
There are two kinds of dynamic data linking mechanisms — Desktop Dynamic Linking and Database Dynamic Linking.
Desktop linking is ideal for visualizing locations across multiple maps simultaneously — the system enables you to select a location on a map or in a database (spreadsheet or profile window) and highlight those geographic locations on (other) maps.
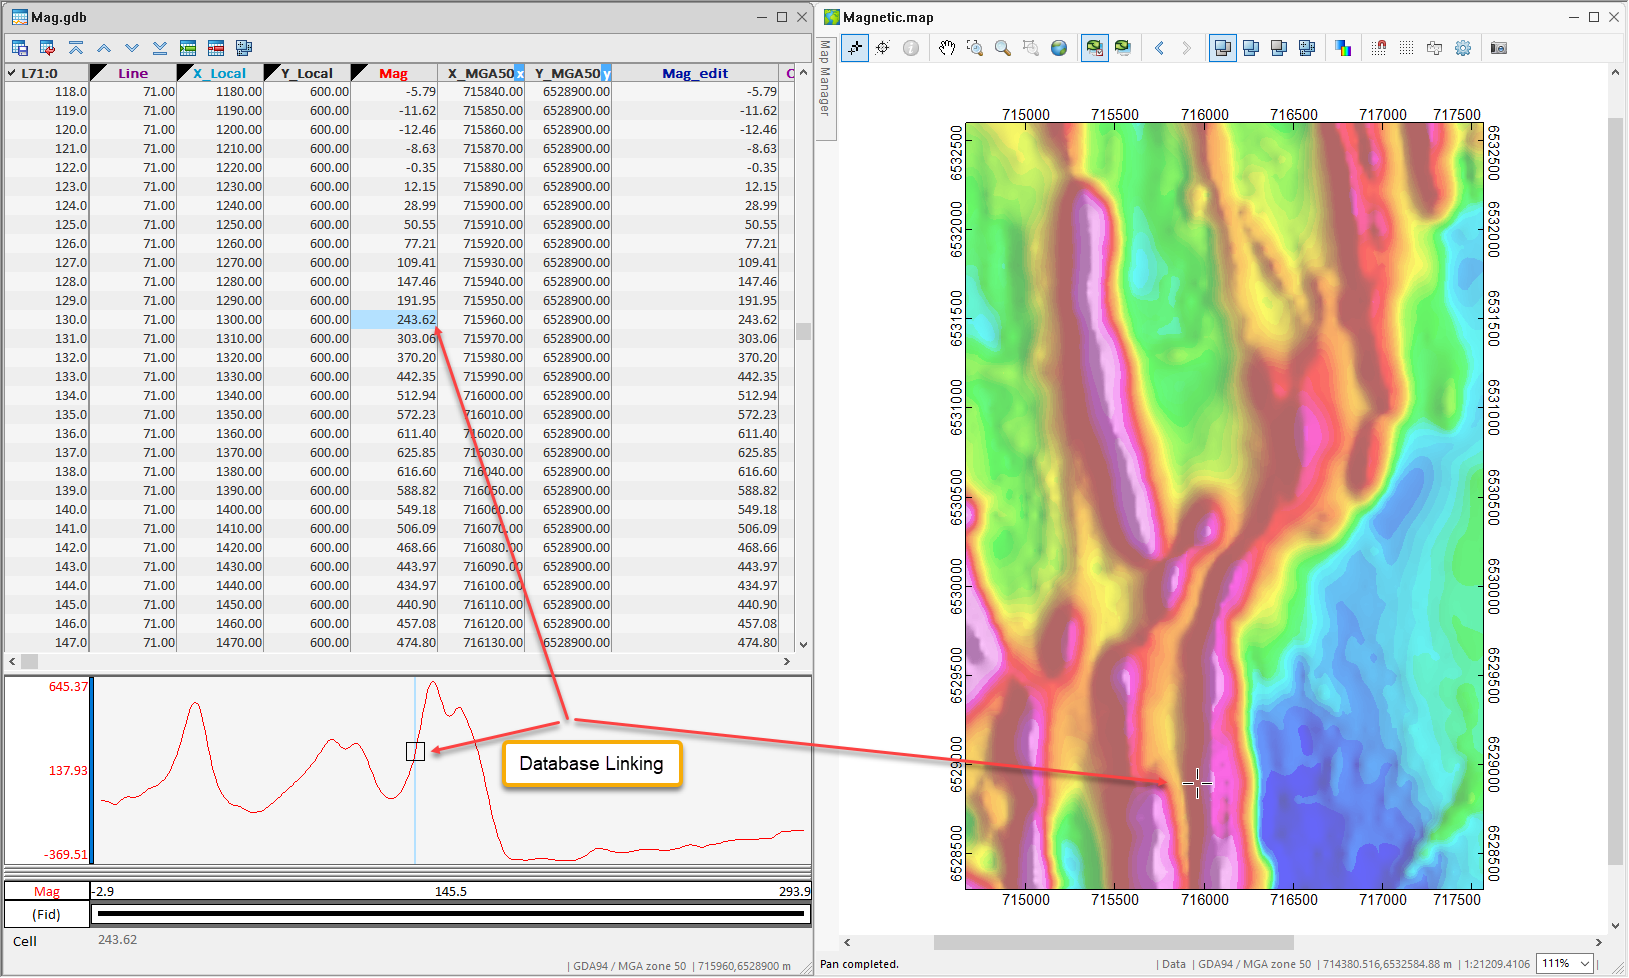
Database linking is ideal for selecting a data point from a map — the system automatically scrolls through the line/groups in the linked database to show the corresponding data point each time you select a location on a map.
Both types of links give you the ability to connect maps, profiles, and data and to visually evaluate relationships between these different views:
- With database linking, you can select an anomaly on an image and immediately see the original data in the Spreadsheet, Profile, and Map form — enabling rapid evaluation and imaging of project data.
- With desktop linking, data from a specific line/group can be visualized on the map as the cursor moves along in the database (spreadsheet or profile window).
Working with Dynamic Data Links
At the most basic level, you can use dynamic linking to link spreadsheet data and profiles. When you work with Spreadsheet and Profile windows and select one or more cells in the Spreadsheet window, the system automatically shows you and locates the corresponding data in the Profile window (or vice versa).
When you work with Spreadsheet, Profile, and Map windows and select a point (cell) in the Spreadsheet or Profile window, the system automatically highlights the corresponding "Shadow Cursor" location in the Map windows.
You can access the data linking tools on the Map navigation toolbar:
- When the
 is selected, and you select a point on a map, that same location is highlighted with a "Shadow Cursor" on the other open maps and grids. In addition, in any open database (spreadsheet and profile) the closest point in the currently visible line/group is highlighted.
 - When your spreadsheet data has multiple lines or groups, select the Data Linking button
 and then select a point on the map, the cursor will ‘snap to’ the nearest data point, and this location is highlighted with a “Shadow Cursor" on the other open maps and grids. In the linked database (spreadsheet and profile) that data point is highlighted automatically, changing the visible line/group as required.
 - To use the Data Linking button and link to a database, your map must contain line/group linking items (i.e. survey lines, symbols, downhole sections or an ArcGIS LYR/LYRX file).
You can also create links between map extents (i.e. panning and zooming for multiple maps will occur simultaneously). This functionality is enabled via the Change Extent tools ( ), on the Map navigation toolbar. For example, to ensure that the cursor location on all maps is always in view, activate the last button in this group: Pan to Cursor on All Maps.
Every time a location is selected on a map using either the Shadow Cursor or the Data Linking tools, the location shadow cursor on the other maps is updated. When the Pan to Cursor on All Maps option is enabled, and the shadow cursor moves out of view, the map will automatically pan to centre on the new cursor location, always keeping the shadow cursor in view.
Link performance is critical and can be a concern for very large databases. However, the design of the Geosoft database and the ability to imbed link information inside visible map entities provides a response that is almost instantaneous.
Got a question? Visit the Seequent forums or Seequent support
© 2024 Seequent, The Bentley Subsurface Company
Privacy | Terms of Use