
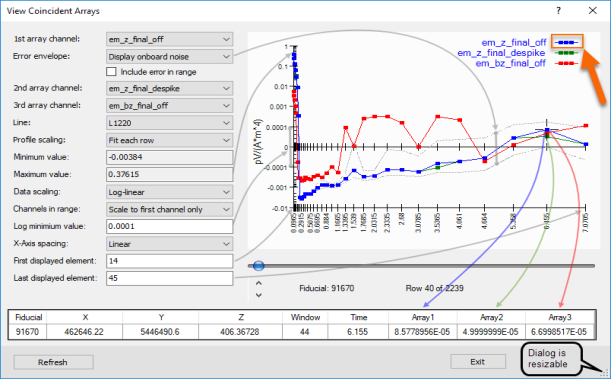
View Coincident Arrays
Use the View Coincident Arrays (VCA) option to display up to three coincident arrays. This interactive tool is available with the following extensions and menus:
-
EM Utilities > View Coincident Arrays: geogxnet.dll(Geosoft.GX.EM.MultipleArrayChannelProfileViewer;Run)*
256-Channel Radiometric Processing extension:
-
RPS > View Coincident Arrays: geogxnet.dll(Geosoft.GX.EM.MultipleArrayChannelProfileViewer;RunForRPS)*
View Coincident Arrays dialog options
|
1st array channel |
Select an array channel to display on the graph. This is the primary channel and will be used to set the vertical and horizontal axes. This channel is assigned the colour blue on the graph. |
||
|
Error envelope |
You can display the error envelope, marked by two grey dashed lines on the graph flanking the 1st array. Options are:
This parameter is not available with the 256-Channel Radiometric Processing extension.
|
||
|
Include error in range |
If checked, the vertical scale is expanded to account for the error range. By default, it is not checked. |
||
|
2nd array channel |
Select another coincident array channel to display on the graph. The channel is plotted similarly to the 1st array channel and it is assigned the colour green on the graph. If the Error envelope option is set to "Display 2nd channel as error", this channel is displayed as two grey dashed lines on either side of the 1st channel, indicating the error envelope. |
||
|
3rd array channel |
Select a third coincident array channel to display on the graph. This channel will be assigned the colour red on the graph. |
||
|
Line |
Select the line to view. You can use the Up and Down arrows on your keyboard to move through the lines. |
||
|
Profile scaling |
The same vertical scale is used for all selected channels. Choose from one of the following options:
|
||
|
Minimum value Maximum value |
By default, the Y-axis is automatically reset to display the selected data array and may be expanded to cover the error envelope. The minimum and maximum entries are populated with the range calculated for the selected profile. However, you can override the vertical scale extends by choosing the Fixed range option. | ||
|
Data scaling |
By default, the scaling of the vertical axis is set to Linear. However, array data often contains values spanning many orders of magnitude. You can view such data using the Log (Logarithmic) scale or the Log-linear scale (see Log minimum value below). | ||
|
Channels in range |
The focus is on the first selected channel. The array base property of the first array channel drives the settings, and it is assumed that if additional array channels are entered, they share the same array base property. The first array channel is also the only one for which you can display an error envelope. Hence, you may want to scale the Y range of the graph based solely on this channel to ensure it is always shown with an adequate dynamic range, regardless of the range of the other two array channels. If so, choose Scale to first channel only. If you prefer a range that covers all selected channels, choose Scale to all channels. | ||
|
Log minimum value |
This entry depends on the Data scaling selection.
|
||
|
X-Axis spacing |
By default, profiles are displayed on the graph as a function of the array index, along equidistant intervals (Equal). If the array base property information is embedded in the array channel, the horizontal axis can be displayed as a function of its true increments. These true increments can be spaced linearly (Linear) or logarithmically (Log). The horizontal axis is annotated accordingly. | ||
|
First & Last displayed element |
You can plot a subset of the array by defining the first and last elements to display on the graph. By default, any leading or trailing dummies in the array are excluded from the graph. | ||
|
Data table |
The numeric representation of the array element at the cursor, along with their coordinates, are displayed in this table. | ||
|
[Refresh] |
While the VCA dialog is running, if you make changes in the database to any of the displayed arrays, you can reflect these changes on the graph by clicking on the Refresh button. |
Application Notes
*The GX.NET tools are embedded in the geogxnet.dll file located in the \Geosoft\Desktop Applications\bin folder. To run this GX interactively (outside the menu), first navigate to the bin directory and provide the GX.NET tool in the specified format. See the Run GX topic for more guidance.
The VCA tool is linked to the current database. Since it is a modeless dialog, you can make changes in the database while VCA is running. However, to update VCA, you must click on Refresh.You do not need to close and reopen the tool.
The first selected array channel drives the graph. Its array base property is honored. If additional array channels are entered, it is assumed that they share the same array base property.
You can move along the array using the scroll bar below the graph and navigate down the line using the arrows below the scroll bar.
To better see overlapping arrays, you can change the size of the symbols on the array graph by clicking on the ends of the topmost line with the three symbols in the legend. Click on the left to decrease the symbol size and on the right to increase it. The symbol size can be adjusted up to a maximum of 5 pixels, with the option to hide the symbols completely by clicking on the left side until they disappear.
See Also:
Got a question? Visit the Seequent forums or Seequent support
Copyright (c) 2025 Bentley Systems, Incorporated. All rights reserved.
Privacy | Terms of Use