
View Coincident Arrays
Use View Coincident Arrays (VCA) (geogxnet.dll(Geosoft.GX.EM.MultipleArrayChannelProfileViewer;Run)*) to display up to three coincident array channels simultaneously. VCA is an interactive, modeless, resizable tool that remains open while allowing full access to workspace functionality.
 Expand to see the menus where this option is available.
-
EM Utilities
-
RPS > Utilities
View Coincident Arrays dialog options
The VCA dialog consists of three main sections:
-
Array selection and display settings (left panel)
-
Graph display and navigation controls (right panel)
-
Tabulated cursor-position values (bottom panel)
Array Selection and Display Settings |
|||
|
1st array channel |
Select the primary array channel to display.
|
||
|
Error envelope |
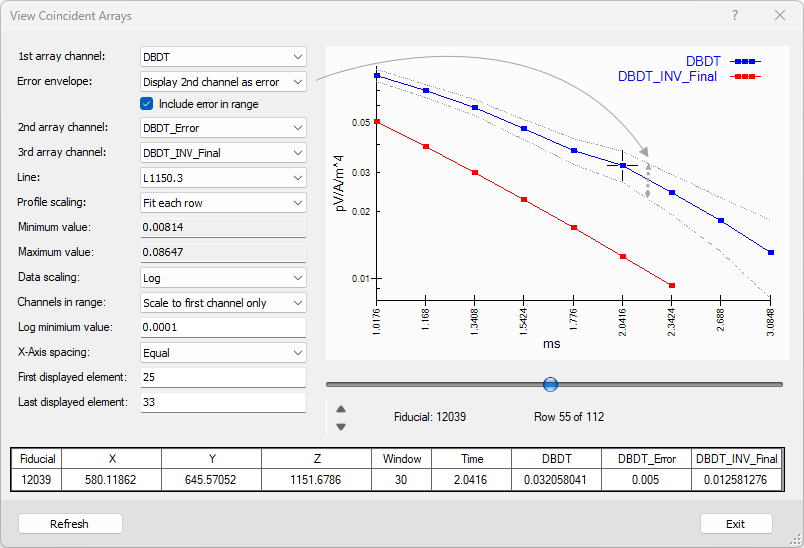
This contextual parameter applies only to EM utilities. Choose how to display error bounds around the 1st array channel:
An error envelope can only be displayed for the 1st array channel. |
||
|
2nd array channel |
Select an additional coincident array to display.
|
||
|
3rd array channel |
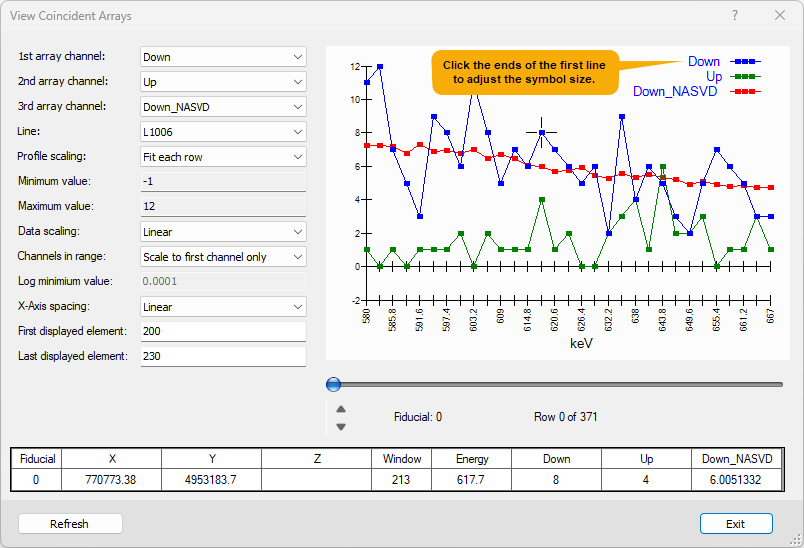
Select an optional third coincident array channel. This channel is plotted in red. |
||
|
Line |
Select the survey line to view. You can also move between lines using the Up/Down arrow keys. |
||
|
Profile scaling |
All selected channels share a common vertical scale. Choose one of the following options:
|
||
|
Minimum value Maximum value |
By default, the Y-axis range is calculated based on the currently displayed profile (and the error envelope, if shown). The Minimum value and Maximum value fields are automatically populated with these calculated limits. To override the automatic scaling, select User-defined range and enter custom limits. |
||
|
Data scaling |
By default, VCA uses a linear vertical scale. For data spanning several orders of magnitude, choose:
|
||
|
Channels in range |
Define how the span of the vertical axis is calculated.
|
||
|
Log minimum value |
This setting controls how low data values are displayed, depending on the selected data scaling mode:
|
||
|
X-Axis spacing |
By default, profiles are displayed as a function of array element indices, using equally spaced intervals (Equal). If the array base property for the first displayed array channel is set, the horizontal (X) axis is annotated using the units of that base property. These increments can be spaced as follows:
Axis annotations update automatically based on the selected mode. |
||
|
First displayed element |
Initially, the entire array (or arrays) is displayed. You can, however, display a subset of the data by specifying the first and last elements. These parameters are defined as array indices, regardless of whether a base property is set. Any leading or trailing dummy elements in the array are automatically excluded from the display by default. |
||
|
Array selection and display settings are retained when the dialog is closed and persist across sessions. |
|||
Graph Display and Legend |
|||
|
The right-hand side of the dialog contains the plot area. The graph updates dynamically whenever you:
The plot supports up to three coincident array channels, rendered in a single graph for comparison. Visual Differentiation Each array channel is visually distinguished using one or more of the following:
The legend in the upper-right corner of the plot identifies each channel and its corresponding colour and symbol. Error Envelopes An error envelope can be displayed around the first array channel to visualise measurement uncertainty or variability.
Example – EM Data The following example shows electromagnetic (EM) data with an error envelope plotted around the first array channel. Coincident Array Behaviour The first selected array channel defines the graph behaviour including:
When additional array channels are selected, VCA assumes they share the same array base property as the first channel. Example – Spectral Radiometric Data The example below shows spectral radiometric data plotted using three coincident array channels. The NASVD-smoothed channel is displayed as the third coincident array, allowing direct comparison with the raw data. Graph Axes
Array Navigation Use the controls located below the graph to navigate through the array:
These controls make it easier to inspect specific windows or array elements, particularly when multiple channels overlap. Array navigation control positions are retained when the dialog is closed and reopened. Symbol Size Control To help distinguish overlapping arrays, you can adjust the symbol size directly from the legend:
The symbol size ranges from 0 to 4 pixels. When you hover over the legend, a tooltip appears indicating how to adjust the symbol size. VCA remembers the last symbol size used and reapplies it when the tool is reopened. |
|||
Tabulated Cursor-Position Values |
|||
|
Data table |
The numeric values at the cursor position on the graph are tabulated below the plot. The data table at the bottom of the dialog displays detailed information for the array element under the cursor, including:
|
||
|
|
|||
|
[Refresh] |
If the VCA dialog is open while you make changes to the underlying database, click Refresh to update the graph and display the latest values. |
||
Application Notes
*GX.NET tools are embedded in the geogxnet.dll file located in the \Geosoft\Desktop Applications\bin folder. To run this GX interactively (outside the menu), navigate to the bin directory and specify the GX.NET tool in the required format. See the Run GX topic for more guidance.
See Also:
Got a question? Visit the Seequent forums or Seequent support
Copyright (c) 2026 Bentley Systems, Incorporated. All rights reserved.
Privacy | Terms of Use