Modify Symbology
Summary
The Modify tab of the Drillhole Symbology pane allows you to create custom symbology styles or appearances that may be difficult or impossible to create using the Esri symbology tools.
Usage
Use the Modify tab of the Drillhole Symbology to create new custom symbology styles to use with drillhole feature classes or attributes. Examples of symbologies that can be created with this tool are:
- Points colored by values or categories
- Points as oriented discs in 3D (for structural datasets)
- 2D or 3D lines colored by values or categories
- 2D or 3D lines sized by values
-
2D or 3D lines colored and sized by values
Parameters
| Parameter | Explanation |
|---|---|
|
Custom Symbology |
Select a style to be used to create the new symbology. The options available are based on the selected layer drillhole data type: Point (single location) Data - Custom Symboloy Options: available when the layer selected is a Point Data Feature Class, e.g. Collars, Depth Ticks, Dip/Azimuth Survey, etc.:
Line Data - Custom Symbology Options: available when the selected layer is a Line type Feature Class, e.g., From-To Data , Traces, etc.:
|
|
Color Field/ |
Select the field to be used to determine the symbology color (or size). |
|
Size/ |
Enter the symbol size or use the arrow buttons to incrementally adjust the value. You can also use the arrow keys on your keyboard to adjust the value. The up/down keys will increase/decrease the value by 1; the right/left keys will increase/decrease the value by 10.
|
|
Offset |
The offset option can be used to shift or move individual data layers so that they are adjacent, not overlapping. Use the offset control to move the selected data layer 'away' from the drillhole trace, to be beside the trace, thus allowing for more data layers to be visualized together. You can also use the arrow keys on your keyboard to adjust the value. The up/down keys will increase /decrease the value by 1; the right/left keys will increase/decrease the value by 10.
|
|
Align |
Choose the "Left" or "Right" option. This will display the data aligned on one side of the hole trace, which creates a 'bar plot' style appearance so that another data set could also be shown. Available on 2D maps only, for line type Feature Classes with custom symboloy sized by values or colored and sized by values.
|
|
Structural Data |
|
|
Color By |
There are three color options that can be used with the Oriented Discs custom symbology:
|
|
Dip Field |
Select a field to be used in orienting the tilt of the disc. Defaults to "Dip" if the field exists. |
|
Dip Direction Field |
Select a field to be used in orienting the direction of the disc. |
|
Disc Size |
Enter a disc size or use the arrow buttons to incrementally adjust the value. You can also use the arrow keys on your keyboard to adjust the value. The up/down keys will increase/decrease the value by 1; the right/left keys will increase/decrease the value by 10.
|
|
Thickness |
Specify a point depth value or use the arrow buttons to incrementally adjust the value. The maximum value is 25. You can also use the arrow keys on your keyboard to adjust the value. The up/down keys will increase /decrease the value by 1; the right/left keys will increase/decrease the value by 10.
|
|
[Apply] |
Click the button to apply the custom symbology to the selected drillhole layer: the layer symboloy will be redrawn based on the applied changes. |
Technical Notes
By default, 2D symbols are measured in points and 3D symbols in meters. See the ArcGIS Pro Help page for more information on the difference between the units and symbol size being used in maps and scenes.
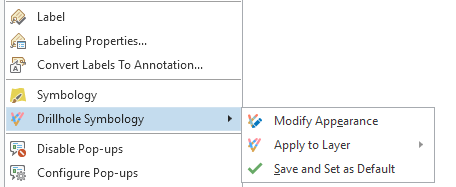
Once you have created or modified a custom symbology using this tool, you can save it by right clicking Drillhole Symbology > Save and Set as Default on the drillhole layer in the Contents pane. This will save the symbology to the current drillhole dataset for future use.
Related Topics
Got a question? Visit Seequent Forums or Seequent Support