
Borehole Correlation Tool
With the borehole correlation tool, you can view and compare selected boreholes in a 2D view. You can then create interpretation tables in which you can assign and adjust intervals and create new intervals. Interpretation tables are like any other interval table in a project and can be used to create models. You can also save and export correlation set layouts and styles that can be exported and used in other Leapfrog Works projects.
This topic describes creating correlation sets and creating interpretation tables. It is divided into:
- Selecting Collars
- The Correlation Set Window
- Correlation Column Layouts
- Managing Layouts and Styles
- Interpretation Tables
- Exporting Correlation Set as a PDF
Selecting Collars
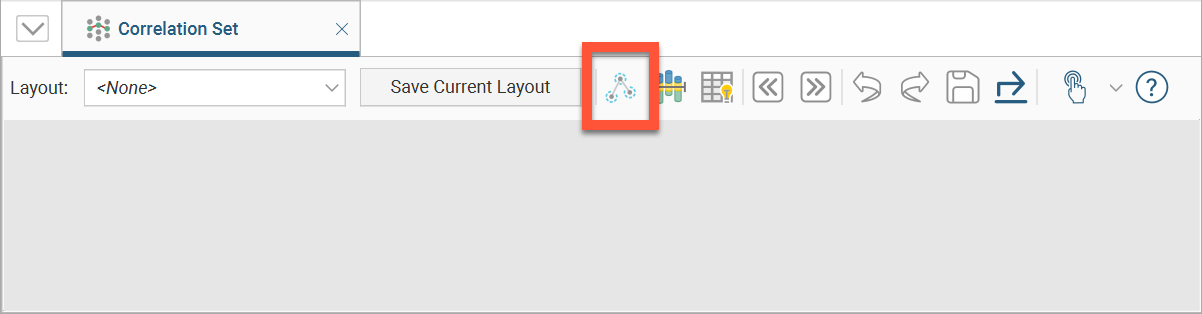
To select collars, you need to create a borehole correlation set, which you can do from the scene. First, add the collars you wish to work with to the scene. Next, right-click on the Borehole Correlation folder and select New Borehole Set. The new set will be created and opened, but is empty until you select collars. Click on the Select Collars button (![]() ) in the correlation set toolbar.
) in the correlation set toolbar.
This will switch you to the scene view where you can begin selecting collars. A useful way of limiting the number of collars displayed is to draw a slice in the scene and set it to a thick slice (![]() ) and set the slice width to hide collars on either side of the slice. Click on the Select Collars button (
) and set the slice width to hide collars on either side of the slice. Click on the Select Collars button (![]() ) in the scene view toolbar, making sure the Add collar button (
) in the scene view toolbar, making sure the Add collar button (![]() ) is also selected, then click each collar you want to include in the correlation set.
) is also selected, then click each collar you want to include in the correlation set.
The numbered line in the scene indicates the sequence in which collars will appear in the correlation set. If you accidentally select the wrong collar, either:
- Click on the Remove collar button (
 ), then click on the collar you wish to remove from the set.
 - Hold down the Ctrl key while clicking on the collar you wish to remove from the set.
You can also:
- Temporarily switch to the Select button (
 ) by holding down the Shift key while clicking.
 - Select all collars visible in the scene by clicking on the Select all collars button (
 ). This will select collars using the best fit line.
 - Clear the selection by clicking on the Clear collar selection button (
 ).
).
If you want to change the order, it is not necessary to de-select and re-select collars; you can easily reorder them later in the correlation set tab by dragging column headers.
Once you have selected the required collars, click the Save button (![]() ). The selected collars will be added to the correlation set window:
). The selected collars will be added to the correlation set window:
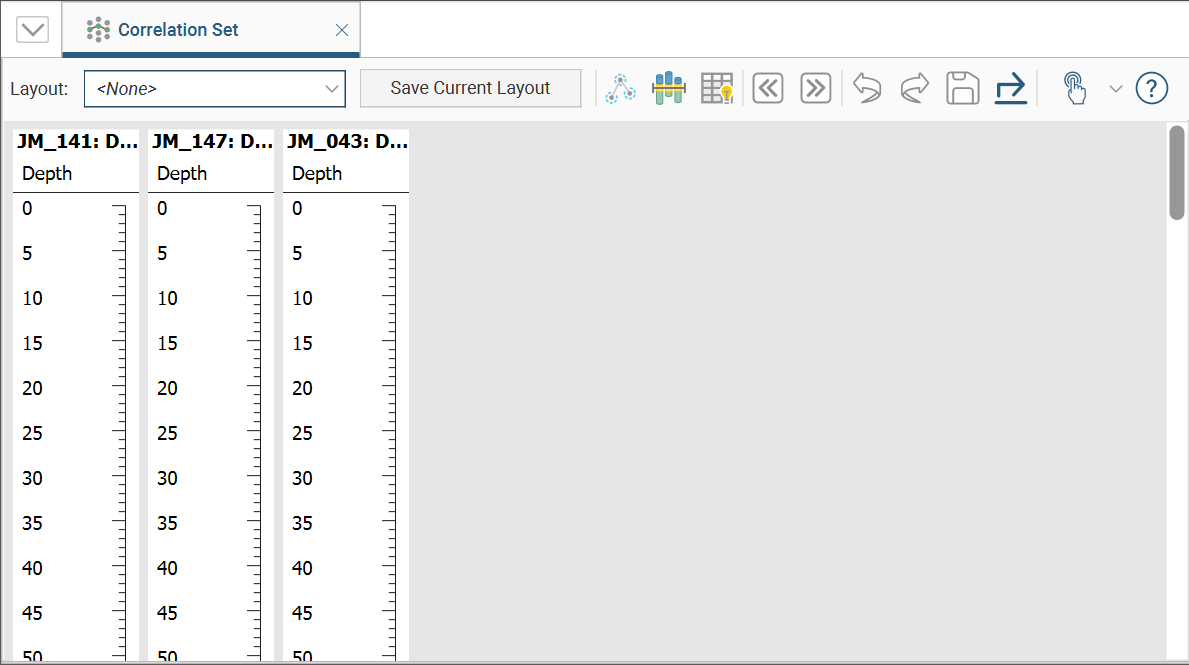
The Correlation Set Window
Each borehole is represented by a vertical panel that can display several columns of information. You can change the sequence the boreholes appear in by clicking-and-dragging the collar to a new position. A vertical line will appear where the borehole will be repositioned.
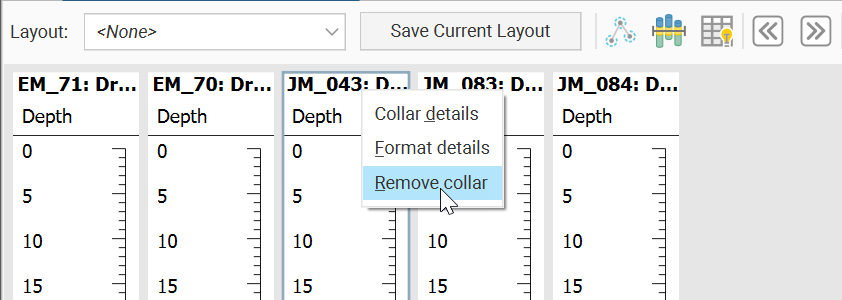
Remove collars from the correlation set by either editing the set in the scene, as described in Selecting Collars above, or right-click on a collar header and select Remove collar from the pop-up menu:
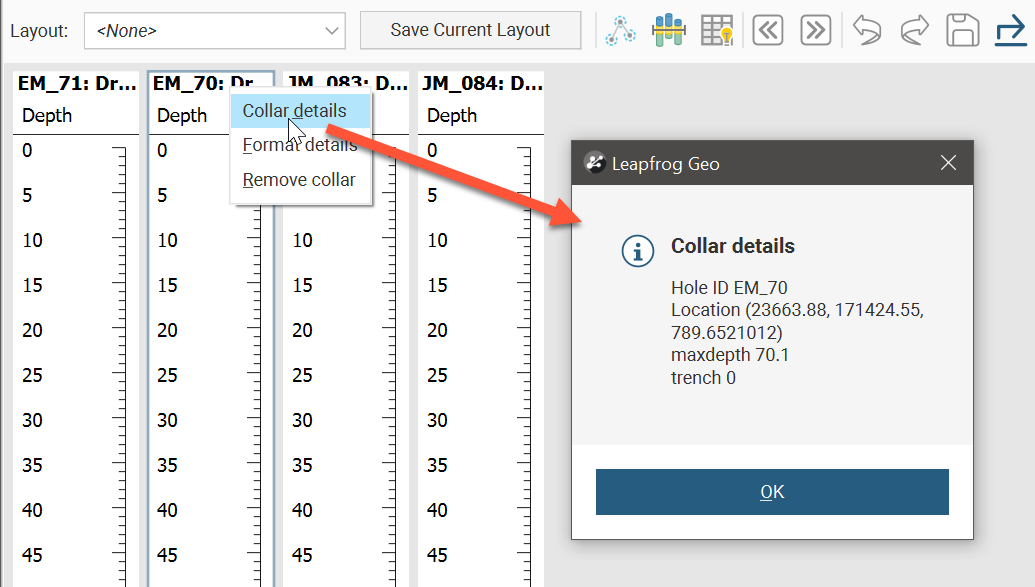
Collar metadata is available by right-clicking on a collar header and selecting Collar details.
Add data columns you want displayed for each drillhole by dragging-and-dropping data columns from the project tree somewhere onto a borehole panel. Depending on whether the data is category or numeric, interval or points data, the default appearance of the data column will be set appropriately. This visual formatting can be adjusted to suit your preference or internal standards.
The sequence of data columns can be changed by clicking-and-dragging the column. A vertical line will appear where the column will be repositioned.
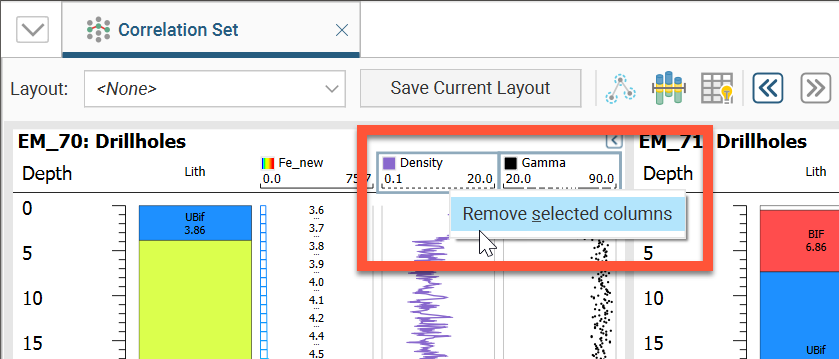
You can remove data columns from the boreholes by right-clicking on a column header, then selecting Remove. Multiple columns can be removed in a single action by holding Ctrl while clicking on the column headers, then clicking on Remove selected columns.
The width of each of the data columns in a vertical borehole panel can be adjusted. Changing the column width in one borehole will also change the width for the corresponding column in all other boreholes in the correlation set.
Boreholes in the correlation set can be individually collapsed and expanded, or collectively collapsed and expanded. To collapse a vertical borehole panel, click the collapse button (![]() ) in the top-right corner of the borehole panel. The collapsed borehole will show an expand button (
) in the top-right corner of the borehole panel. The collapsed borehole will show an expand button (![]() ) in its place that can be used to reveal the borehole data once again. To collapse all the boreholes, click the Collapse all drillhole information button (
) in its place that can be used to reveal the borehole data once again. To collapse all the boreholes, click the Collapse all drillhole information button (![]() ) in the correlation set toolbar. The Expand all drillhole information button (
) in the correlation set toolbar. The Expand all drillhole information button (![]() ) restores the view for all boreholes.
) restores the view for all boreholes.

The borehole collar header can be customised using combinations of static labels and variables. Right-click on the existing collar header and select Format details. The Format Collar Details window has a Label editor where the default label can be customised and replaced. Type in the Label editor to add text that will be included in all the collar headers, and select from the Insert Column list to add a variable that will contain metadata specific to the borehole collar. Some variables may also show Properties to the right that can be adjusted when selected in the Label editor.
See Text Formatting in the Visualising Data topic for more information on how to use the text formatting dialog.
Click on Close to save your changes, or Revert to discard them. Click on the Clear button (![]() ) to delete the contents of the Label editor and restore the default label of holeid: Drillholes.
) to delete the contents of the Label editor and restore the default label of holeid: Drillholes.
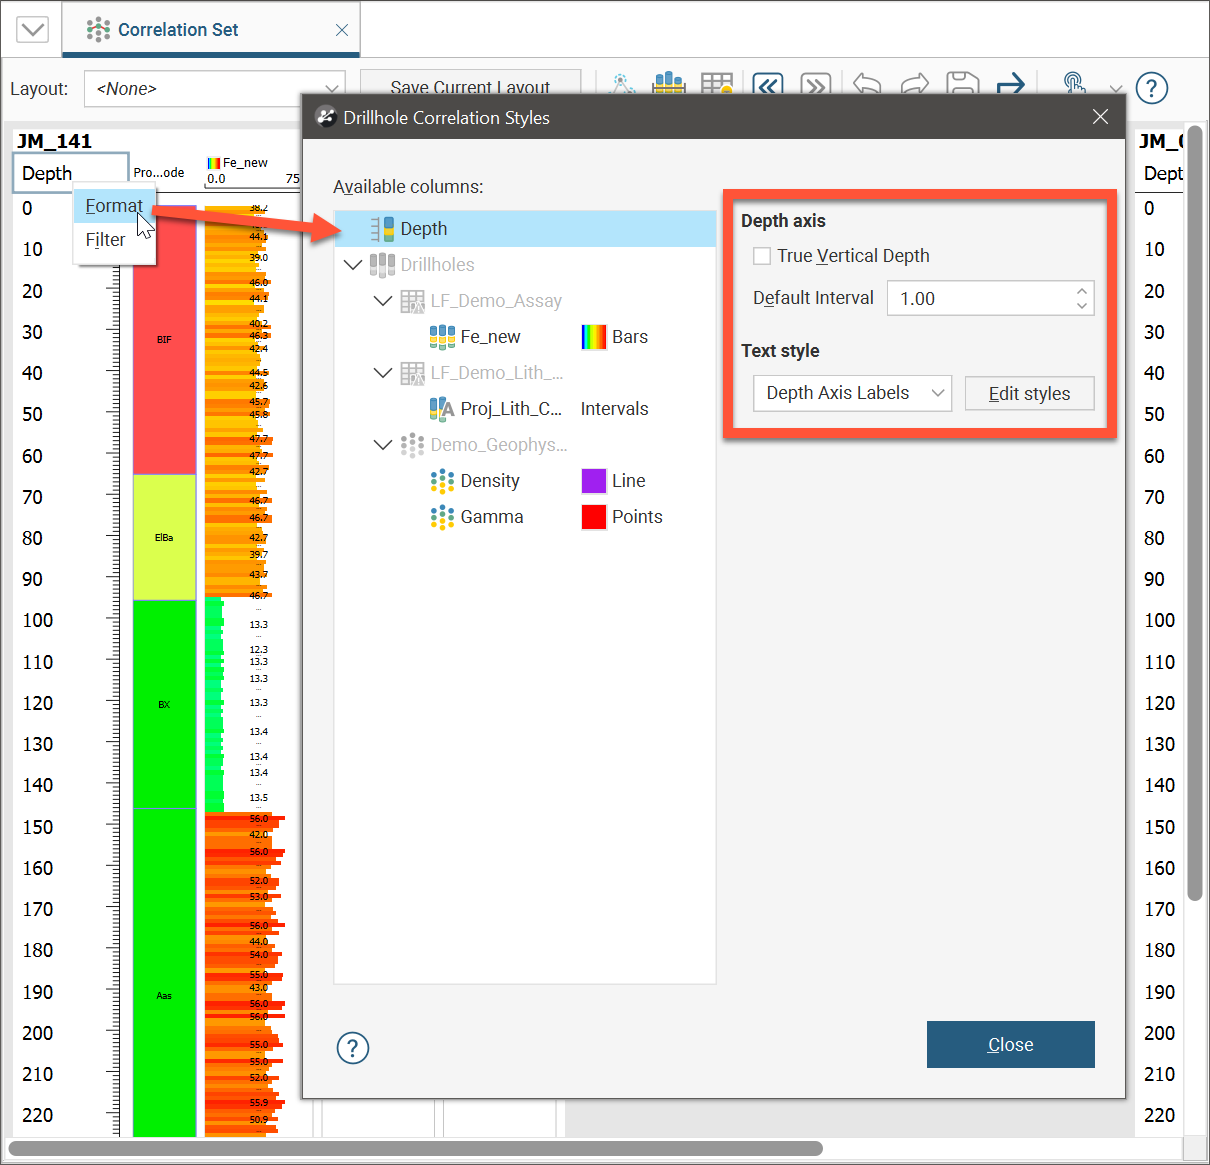
Customise the depth scale by right-clicking on Depth or TVD and selecting Format from the popup menu. The tick interval can be adjusted by changing Default Interval, and the Text style can be changed by selecting one of the named text styles and/or clicking the Edit styles button where the font, point size and colour can be specified, along with whether or not the text should be bold or italic.
It is also possible to tick the True Vertical Depth box to change the depth scale from downhole distance to true vertical depth. When selected, the Depth label is changed to TVD, and the borehole data is referenced to the z-height. In conjunction with the Elevate Collars feature, this may be especially useful with boreholes with significantly different dip angles.
Constrain a drillhole or the entire correlation set to a depth of interest by setting the depth filter. Right-click Depth or TVD for a borehole and click Filter from the popup menu. In the Depth Filter window, specify the From and To depth constraints. If Apply to all is unticked, the changes will only apply to the borehole selected when Depth or TVD was right-clicked. If Apply to all is ticked, the depth filter will affect all boreholes in the correlation set. Any borehole with a depth filter applied will have a filter indicator (![]() ) above the scale.
) above the scale.
Correlating data is harder when the topography is not flat and the borehole collars are at different elevations, unless the starting points for each borehole are adjusted to be relative. Click the Elevate Collars button (![]() ) and a Collar Elevation scale is added to the left side of the correlation set and the borehole collars are set to their z-height. Click the Elevate Collars button again to reset the depth scales so they are not relative.
) and a Collar Elevation scale is added to the left side of the correlation set and the borehole collars are set to their z-height. Click the Elevate Collars button again to reset the depth scales so they are not relative.
The columns in the correlation set can be formatted and styled to present the data in a manner that suits your analysis and presentation needs. Right-clicking any column header and selecting Format will open the Borehole Correlation Styles window. Position this window so you can see the correlation set, as style changes made in this window are updated immediately in the correlation set.
Each of the displayed columns is shown in the Available columns list and when a column is selected, formatting and styling options appear on the right side of the window, specific to the type of column data selected.
Under the Format heading, the Display type provides options for displaying data as Bars, a Line, Points or Midpoints or Intervals. Available options will be limited by the selected data type.
When Bars are selected for the Display type, the Bar Style section provides styling options for the bar chart. The Colouring can be specified as a Flat colour and a specific colour selected by clicking on the colour chip, or an available colourmap can be selected from the dropdown list. Colourmaps are not defined or managed within the Borehole Correlation Styles window; the available colourmaps match those defined for the data column when added to the scene. If necessary, add a new colourmap from the shape list.
Tick Outline only
to change the bar style from bars filled with colour to bars with a coloured outline and a white fill. Note: when Outline only is enabled, where the edges of two bars are adjacent, the colour of the bar with the higher value is used.
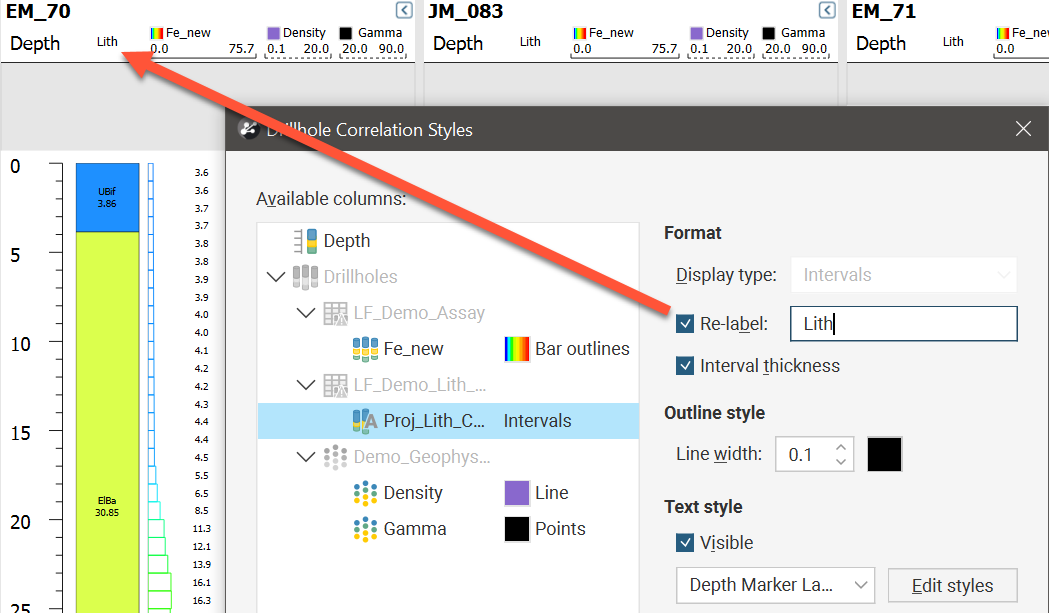
Change the default data column header label by ticking Re-label and providing a new header label.
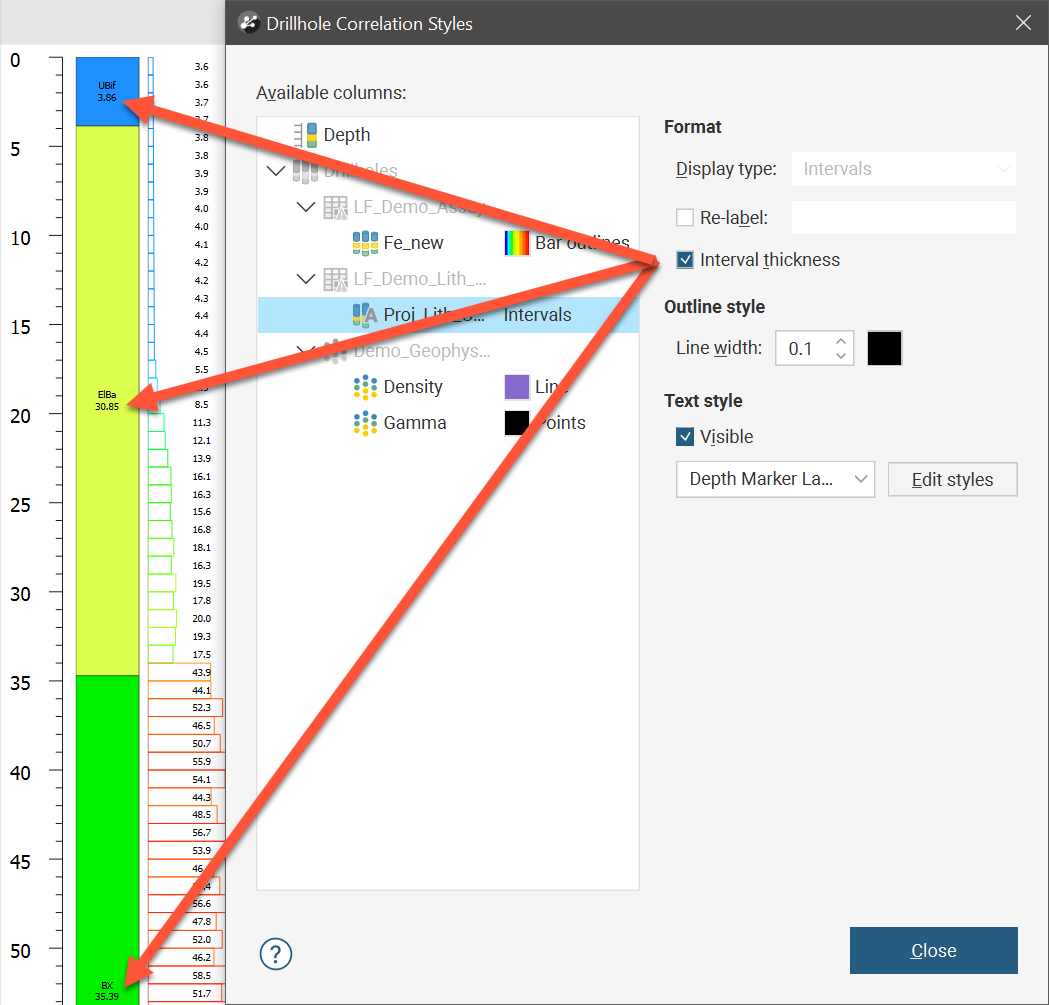
When the Display type is Intervals, there is an option to show Interval thickness. This will add the thickness dimension to the interval label for each interval.
Numeric data columns have Numeric display range options. You can constrain the plot axis by ticking Apply display range and specifying a Minimum and Maximum for the axis. You can also adjust from a linear scale for the axis to a log scale by ticking the Log transform box. Note the styling of the axis line under the column header indicates the type of axis: a solid line indicates a linear axis with a range that represents the full scale of the data values in the column, a regular dotted line indicates a linear axis with a restricted range, and a dotted line with varying dot lengths indicates a log axis.
You may choose to round data values shown in the correlation set for numeric data columns. Tick Apply rounding and specify how many Decimal points to show.
It is possible to overlay numeric data plots. Click-and-drag a column header and drop it on top of another column header, and both sets of data will be plotted together, with adjacent axes above. Note that it is not possible to display category data on top of other category data.
Dragging a column header between two other column headers will re-order the columns.
The styles used to display columns can be used by other sets in the project and can be exported to other projects. See Managing Layouts and Styles below.
Navigating in the Correlation Set Window
Navigate in the correlation set window using the following mouse and keyboard combinations:
- Use the scroll wheel to move up and down.
- Hold down the Shift key while scrolling to move right and left.
- Hold down the Alt key while scrolling to stretch and compress the data vertically.
- Hold down the Ctrl key while scrolling to zoom in and out.
Click the navigation options button (![]() ) to see a ready reference for these controls.
) to see a ready reference for these controls.
As column data becomes more compressed, data labels could overlap to the point of becoming unreadable. To avoid this situation, some labels are actively omitted from the correlation set view as the column compresses. Where labels have been omitted, ellipses are inserted to indicate the label’s absence. Higher values are presumed to be more relevant and will be preserved in preference to lower values in this simplification process.
Correlation Column Layouts
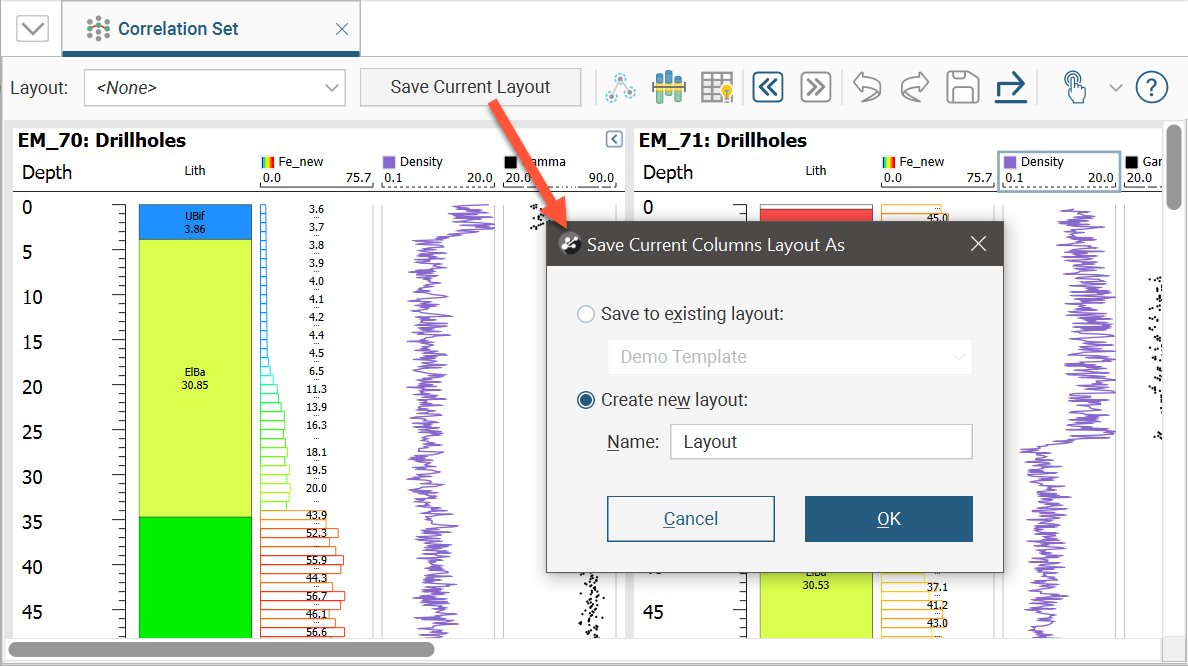
Once you have formatted and styled a correlation set, you can save this styling as a layout that can be applied to other correlation sets. Click on the Save Current Layout button in the toolbar, then either select Save to existing layout and select an existing layout to overwrite, or select Create new layout and provide a Name for the layout.
Layouts can be applied to a correlation set by selecting one of the existing options from the Layout dropdown list.
Managing Layouts and Styles
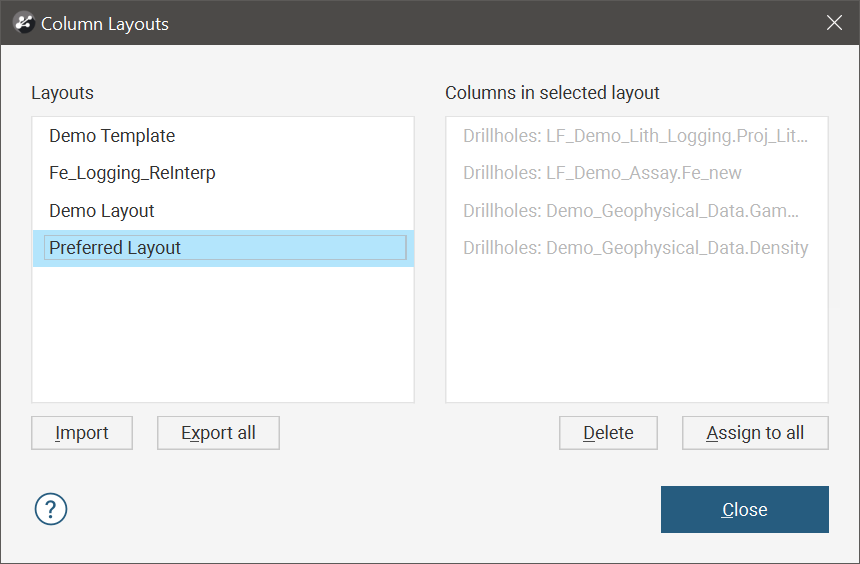
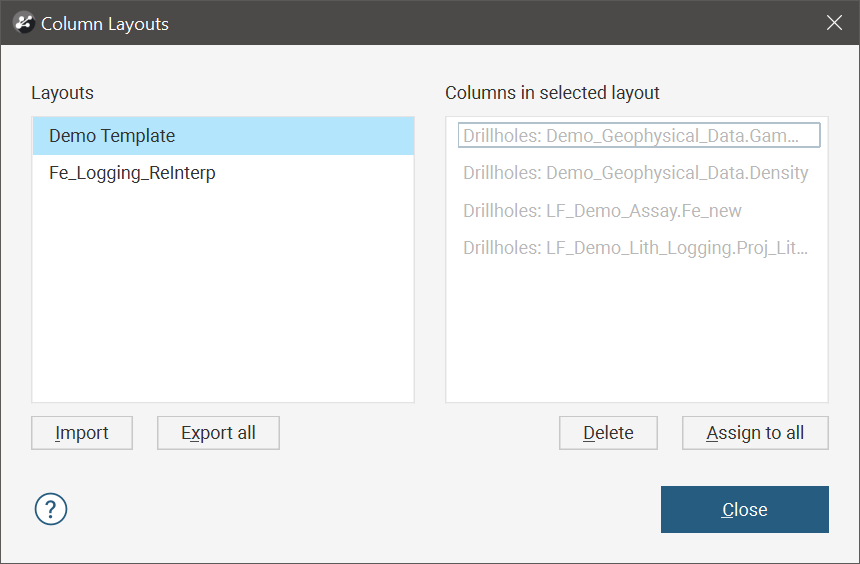
To manage correlation set layouts, right-click on Drillhole Correlation in the project tree and select Layout Manager from the popup menu. Here a layout can be selected and re-used for all correlation sets in the project by clicking the Assign to all button. The Column Layouts window also provides the option to Delete a selected layout.
To re-use the correlation set layouts in other projects, click the Export All button and provide a filename.
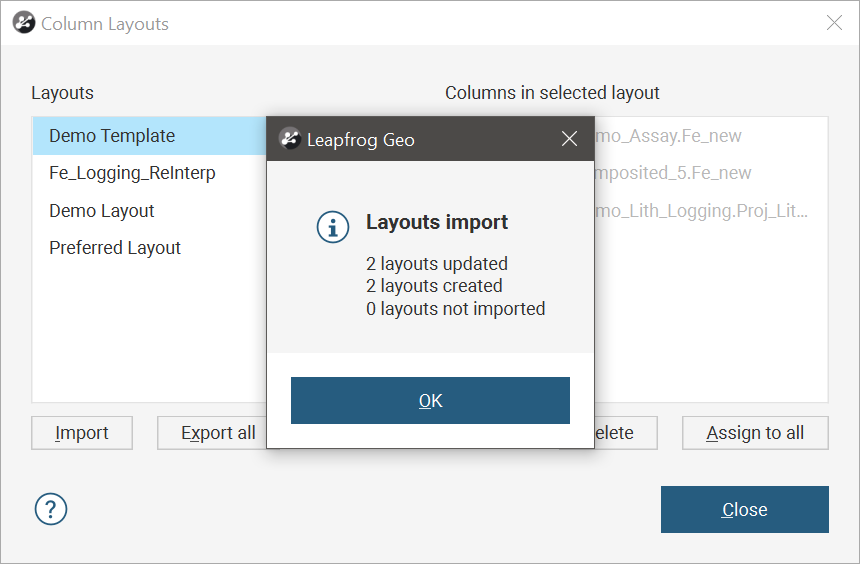
In another project where the correlation set layouts are to be re-used, right-click on Drillhole Correlation in the project tree. Select Layout Manager and click the Import button.
The Column Layouts window will be updated and a informational dialog will let you know how many layouts were imported from the file.
You can then select an imported layout to Assign to all correlation sets or open individual correlation sets and change the Layout to suit from the available options.
It is also possible to export and import the column styles being used within correlation set layouts. Right-click on Drillhole Correlation in the project tree and click Export Column Styles in the popup menu. You will be prompted to provide a filename for the exported file.
In a project where you wish to re-use column styles from another project, right-click on Drillhole Correlation in the project tree and click Import Column Styles in the popup menu. The Import Column Styles window will open.
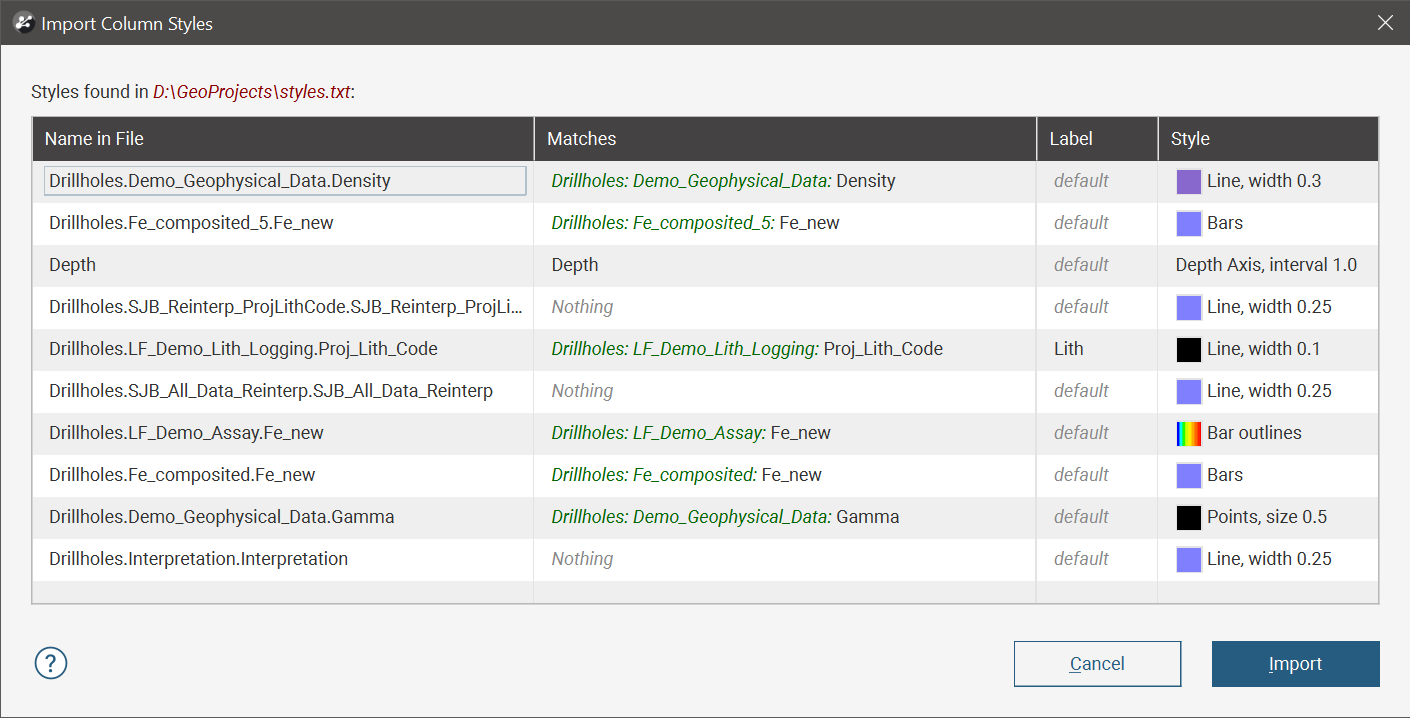
This window will indicate which of the styles in the imported file Leapfrog can automatically match with columns in the currently open project. There is no option to make assignments of column styles to unmatched columns in the project. Click Import to assign the column styles to the matched columns.
Interpretation Tables
With interpretation tables, you can assign and adjust intervals and create new intervals. Interpretation tables are like any other interval table in a project and can be used to create models.
To create an interpretation table, click the New Interpretation button in the correlation set window. The New Interpretation Table window will be displayed:
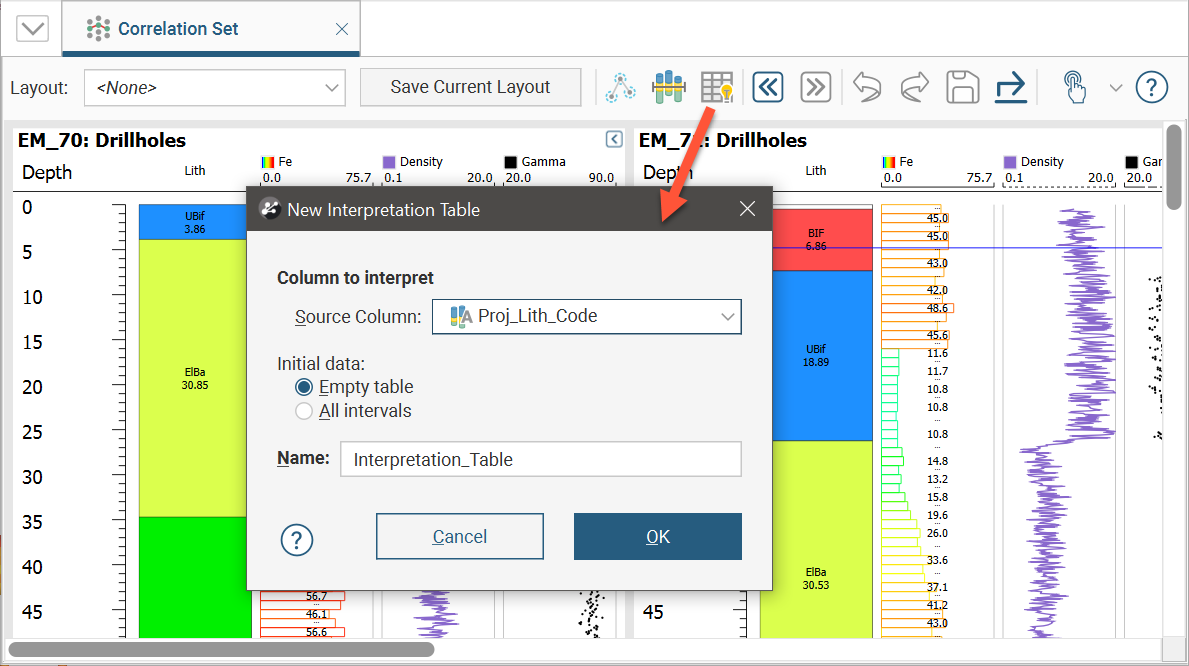
There are three options for creating an interpretation table:
- Create the table without using a base table. Each borehole will have an empty legend and a single empty interval from 0 to its maximum depth. Select <None> for the Source Column.
- Create the table from a base column but have no intervals. This copies the base column’s legend but no intervals. Select the Source Column, then select Empty Table.
- Create a copy of a table. Select the Source Column, then select All Intervals.
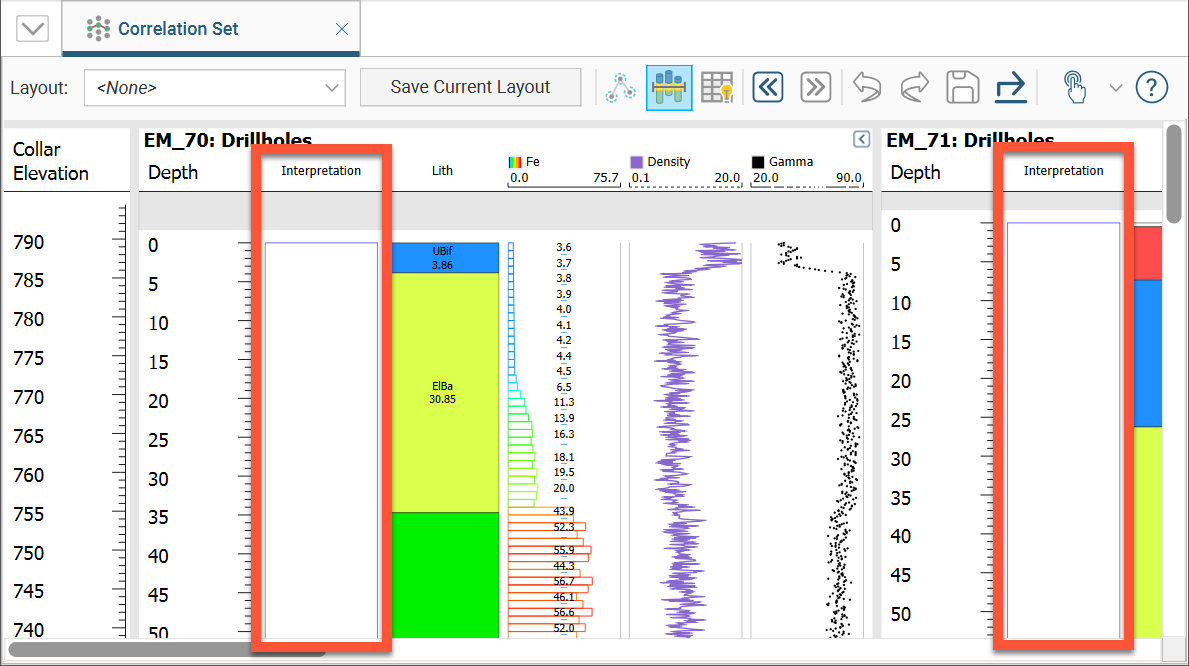
Click OK to create the table. A new interpretation table will be added to the project tree in the selected drilling data set and the column will be added to the correlation set window:
Assigning Lithologies
If you have created the interpretation table without using a base table, you will need to assign lithologies to the new table. Do this as part of working with the table in the correlation set window, which is described below.
Modifying the Interpretation Table
In the correlation set window, the blue line that appears as you mouse over the columns is used to create intervals. Position the blue line then right-click on it and select one of the options:
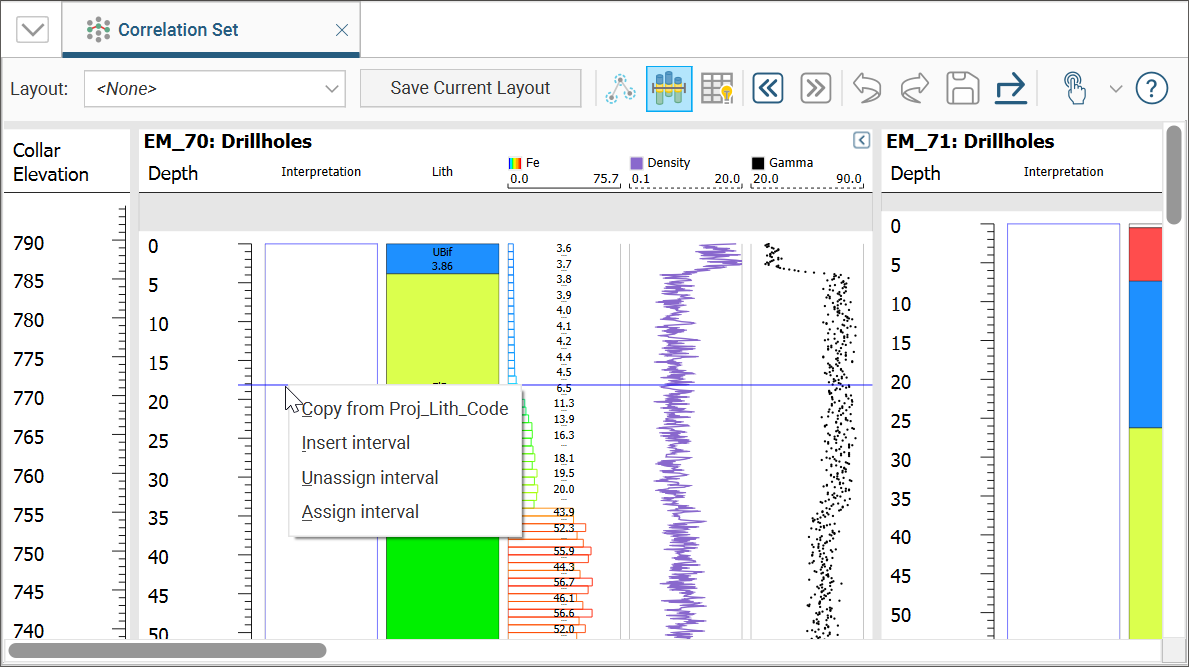
- The Copy from option assigns intervals from the base table.
- The Insert interval option adds an empty interval that overrides any intervals already defined.
- The Unassign interval option clears the lithology assigned to the interval.
- The Assign interval option opens the legend for the interpretation table so you can select a lithology to assign to the interval. If you need to add lithologies, you can do so in this window.
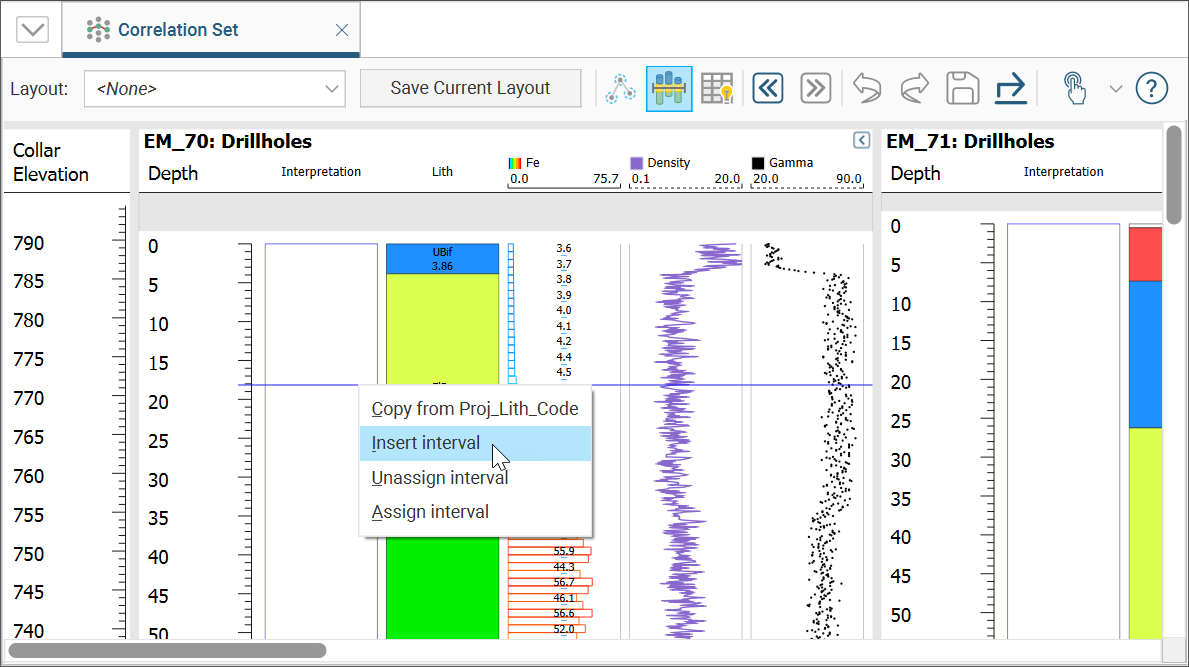
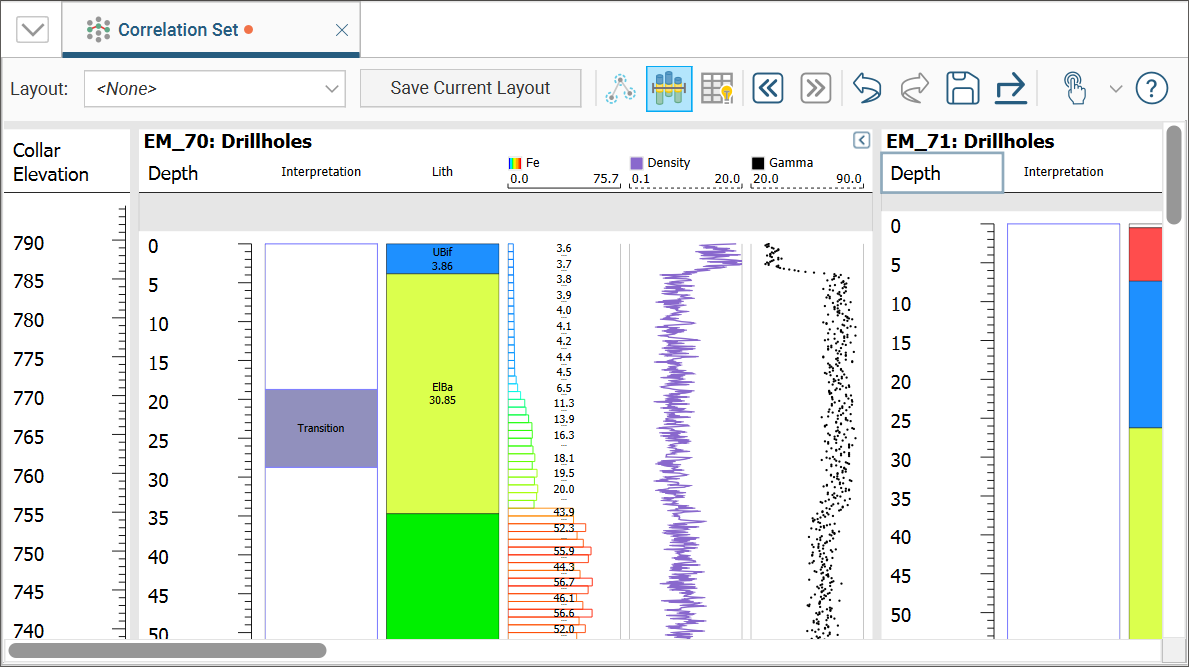
For example, to break up the “ElBa” interval below and create an interval called “Transition” where the “Fe” values are raised, move the blue line near to where you wish to create the interval. You do not need to be precise as you can adjust the interval once you have added it. Right-click and select Insert interval:
In the legend window, click the Add button and add a lithology called “Transition”:
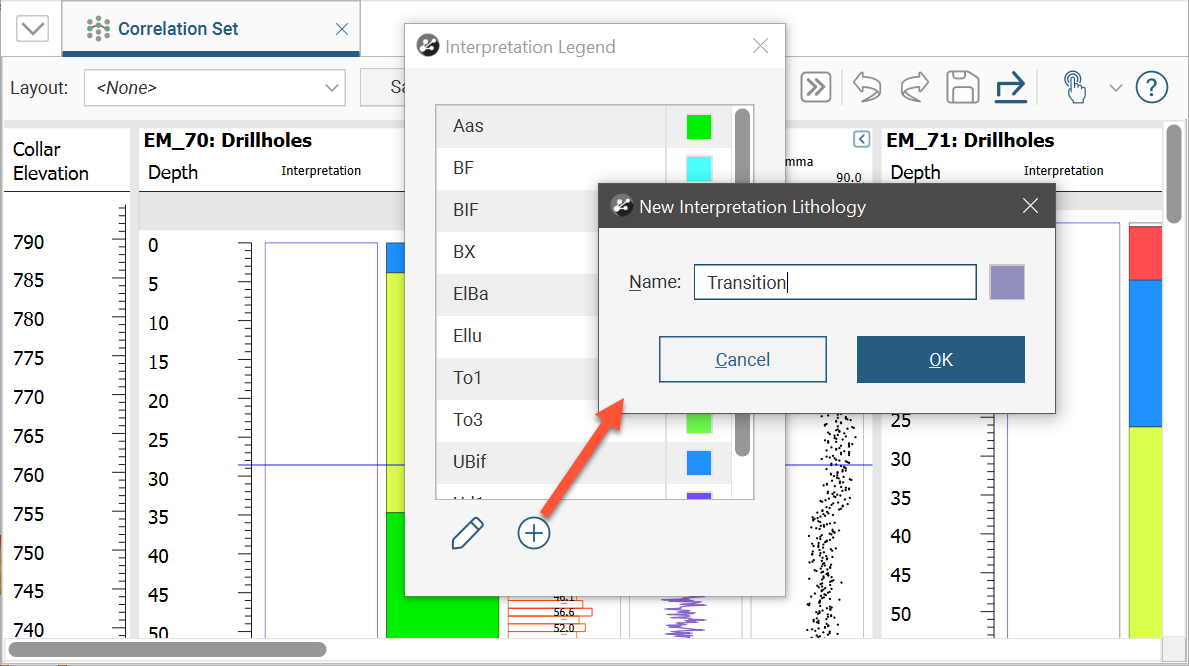
Click OK to select the new lithology and close the legend window. The new lithology has been assigned to the interval:
To resize the interval, click and drag the interval end points:
You can move the interval end point and snap it to a data point in another column. To do this:
1. Click on the interval end point and drag it into position without releasing the mouse button.
2. Move the mouse across to the data point you wish to snap to.
3. Release the mouse.
You can also snap to points along the depth axis.
Continue making changes to the interpretation table, using the Undo button to step backwards if necessary. Save changes to update the table.
Exporting Correlation Set as a PDF
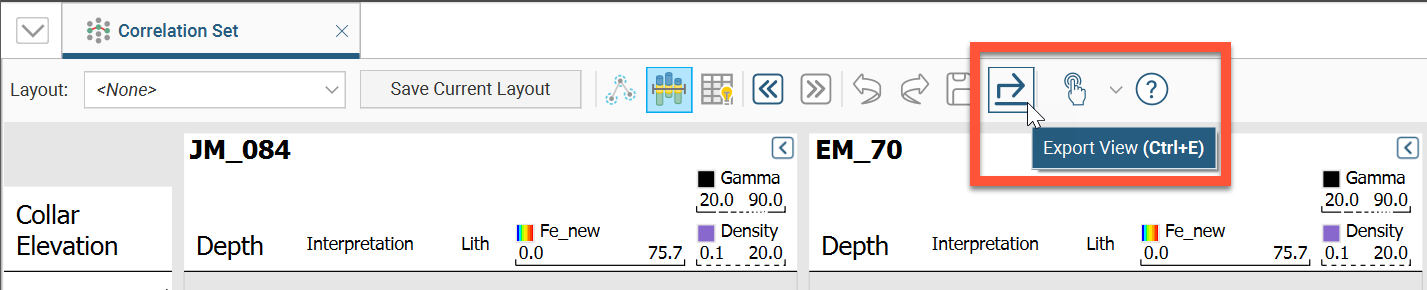
The current correlation set view can be exported as a PDF for use outside Leapfrog Works. Click the Export View button (![]() ) in the correlation set toolbar and provide a filename when prompted. You will also be given the option to open the file in the application associated with the *.pdf file extension.
) in the correlation set toolbar and provide a filename when prompted. You will also be given the option to open the file in the application associated with the *.pdf file extension.
Got a question? Visit the Seequent forums or Seequent support
© 2023 Seequent, The Bentley Subsurface Company