
Experimental Variography and Variogram Models
The features described in this topic are only available if you have the Contaminants extension.
After data analysis and domaining comes the key part of the contaminant estimation workflow: variography. A theoretical variogram model is proposed and tested using experimental variography. Kriging, nearest neighbour, inverse distance weighting or RBF estimators are defined and potentially combined.
Variography is the analysis of spatial variability of values within a region. Understanding how sample values relate to each other in space is a vital step in informing estimates in a contaminant model. A variogram is used to quantify this spatial variability between samples.
In estimation, the variogram is used for:
- Selecting appropriate sample weighting in Kriging and RBF estimators to produce the best possible estimate at a given location
- Calculating the estimators’ associated quality and diagnostic statistics
In Leapfrog Works contaminant estimations, variograms are created and modified using the Spatial Models folder. To create a new variogram model, right-click on the Spatial Models folder and select New Variogram Model.
A new variogram model is not auto-fitted and should not be assumed to be the initial hypothesis for the workflow. While some reasonable defaults have been selected for the variogram model, the geologist’s personal hypothesis should be the starting point for the estimation workflow.
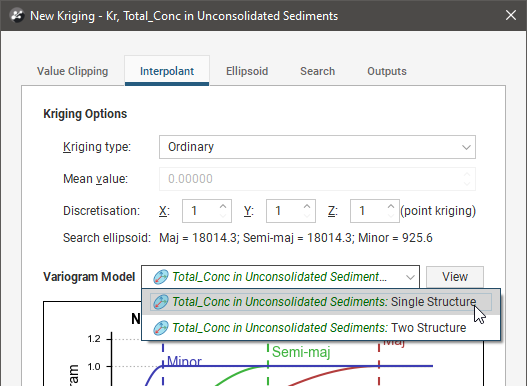
You can define as many variograms as you wish; when you define an estimator that uses a variogram model, you can select from those available in the estimation’s Spatial Models folder:
Working with variograms is an iterative process.
The rest of this topic provides an overview of the Variogram Model window. It is divided into:
Separate topics describe how to use the different tools available for working with variograms; they are the Variogram Model Controls topic and the Experimental Controls topic.
See The Ellipsoid Widget for information that is useful in working in the Variogram Model window.
The Variogram Model Window
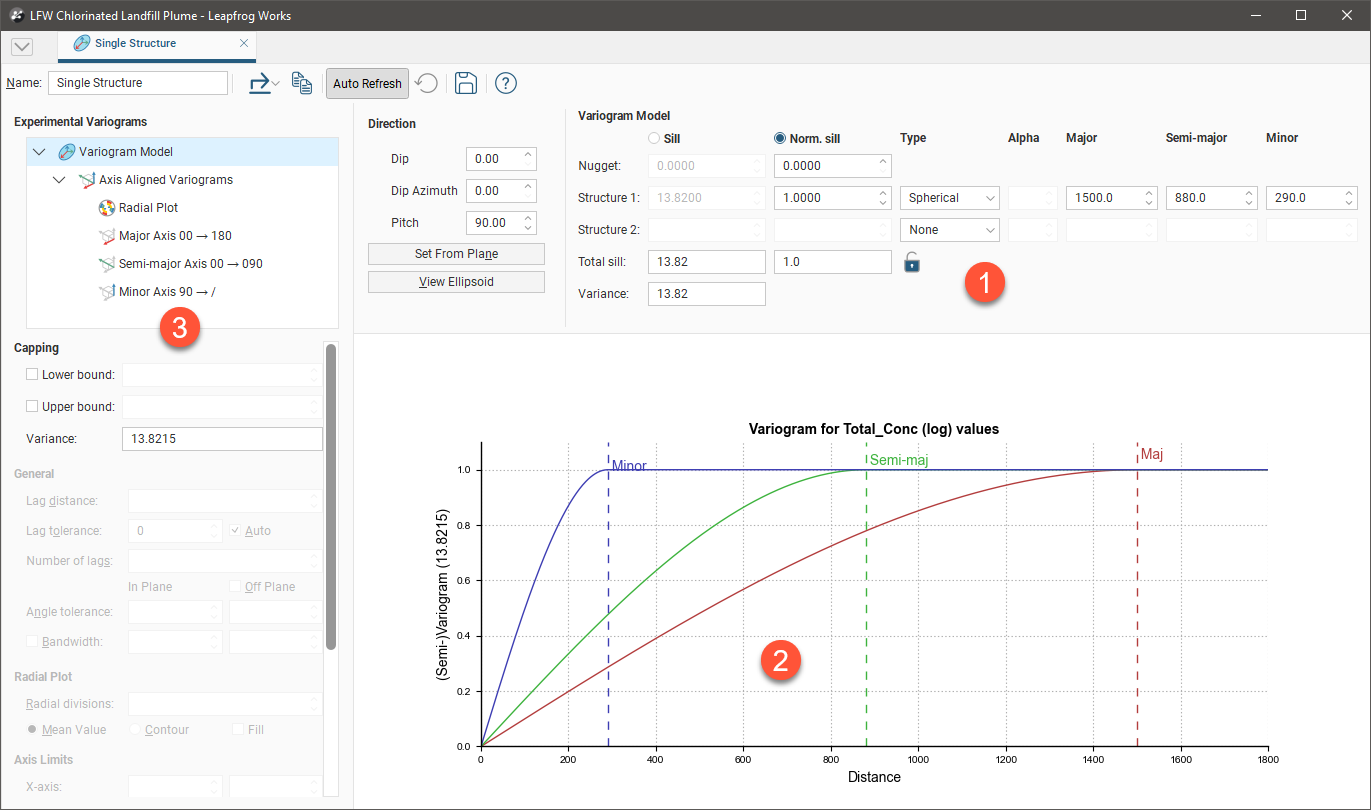
The Variogram Model window is divided into three parts:

|
Variogram model controls for adjusting the variogram model type, trend and orientation. See Experimental Variography and Variogram Models below. |

|
Graphs plotting the selected variogram |

|
Experimental controls for verifying the theoretical variogram model. See Experimental Variography and Variogram Models below. |
When you edit a variogram model in the Variogram Model window, an ellipsoid widget is automatically added to the scene. The ellipsoid widget helps you to visualise the variogram in 3D, which is useful in setting variogram rotation and ranges and in defining search neighbourhoods.
If the Variogram Model window is docked as a tab, you can tear the window off. As a separate window, you can move and resize the window so you can see the ellipsoid change in the 3D scene while you make adjustments to the model settings. The detached window can be docked again by dragging the tab back alongside the other tabs, as described in Organising Your Workspace.
There are two ways to save the graph for use in another application:
- Click the Export button (
 ) and select Export graph image to export the graph as a PDF, PNG or SVG file.
 - Click the Copy graph button (
 ) to copy the graph to the clipboard. You can then paste it into another application.
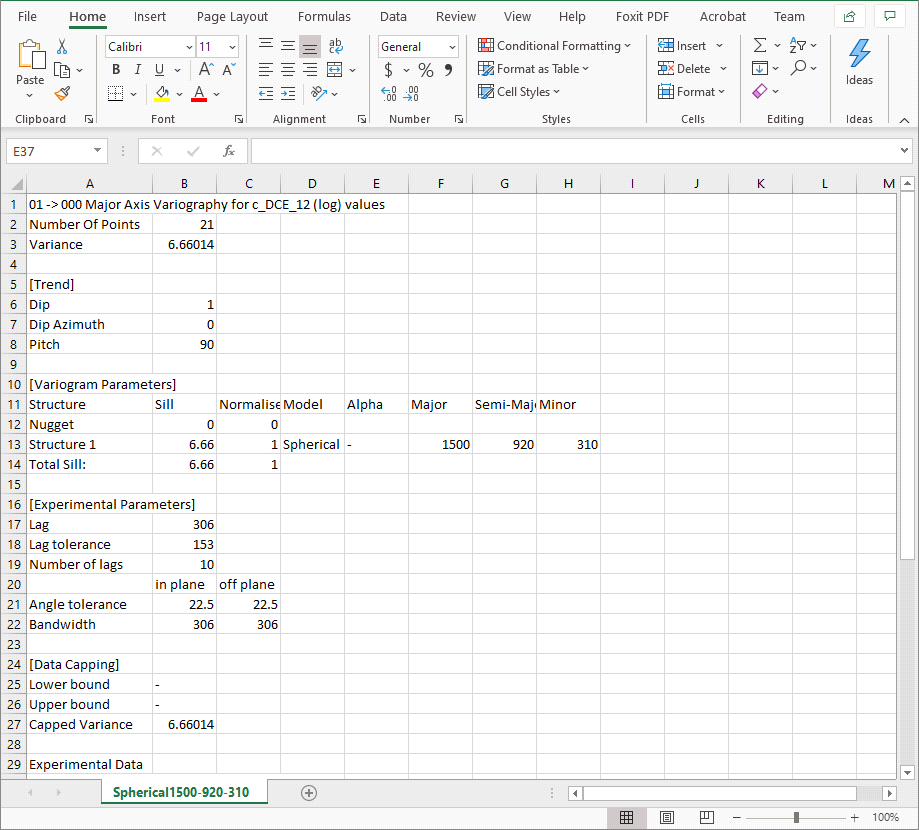
Additionally, you can save variogram parameter data by selecting a theoretical variogram from the list, clicking the Export button (![]() ) and selecting Export data from the options. Note that Export data is not available for the experimental variogram or the Radial Plot.
) and selecting Export data from the options. Note that Export data is not available for the experimental variogram or the Radial Plot.
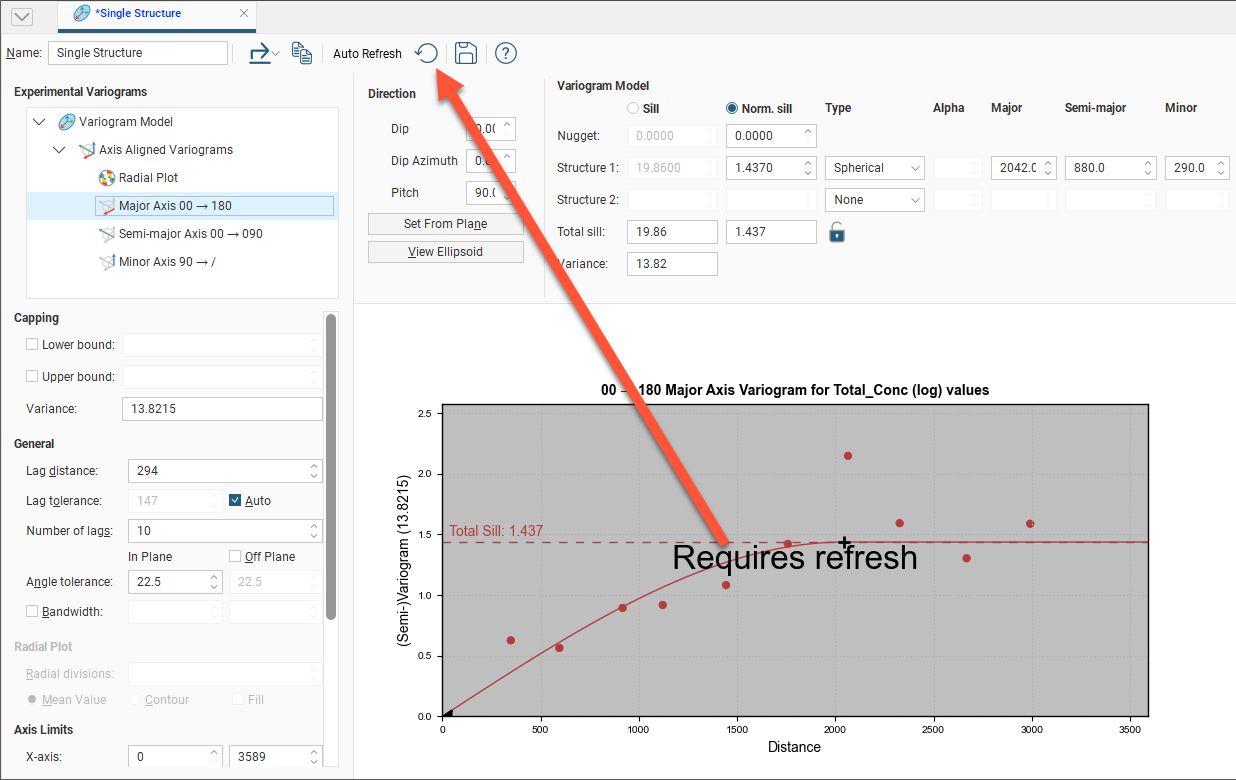
There are two buttons for refreshing the graphs when changes are made:
- When Auto Refresh is enabled, recalculations will be carried out each time you change a variogram value. This can produce a brief lag.
- When auto refresh is disabled, you can click the Refresh button (
 ) whenever you want the graphs to be updated. This is the best option to use when working with a large data set.
If auto refresh is disabled and values have been changed without the graphs being updated, the chart will turn grey and a reminder will be displayed over it:
Exporting and Importing Variograms
The ability to export and import variogram models is useful for re-using variogram models in the same project or in other projects.
To export a variogram model as a *.lfv file on your local workstation, right-click on a variogram model in the project tree and select Export. Select where you want to save the file, then click Save.
You can also choose to publish a variogram model as an object to a Central project. When you click Publish, ensure that the variogram model you want to export to Central is ticked when selecting the objects to publish. For more information on how to publish variogram models and other objects to Central, see Publishing to Central.
To readily distinguish between variogram model objects, consider giving your variogram models unique names.
You can then import a variogram model saved using one of the techniques above into another estimation.
To import a saved *.lfv file, right-click on a Spatial Model folder under the target estimation and select Import Variogram Model > Local. Navigate to where the variogram file is saved and click Open.
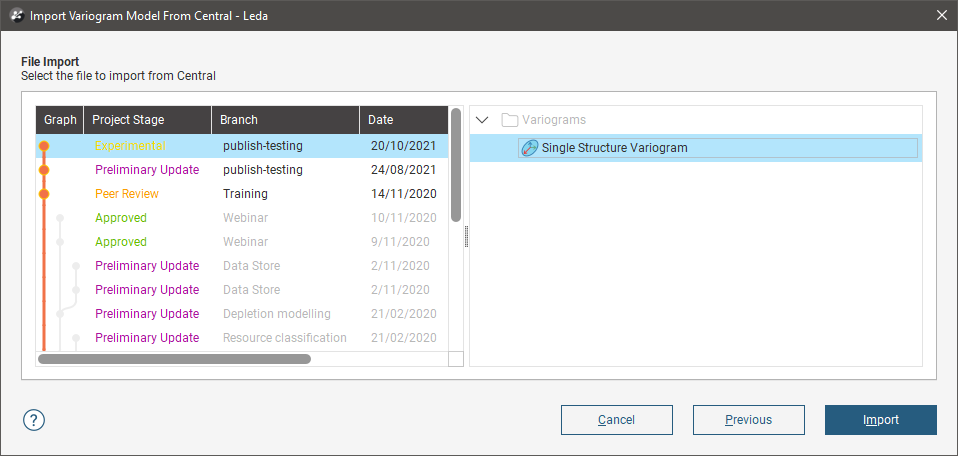
To import a variogram model stored in a Central project, right-click on a Spatial Model folder under the target estimation and select Import Variogram Model > Central. Select the project where the variogram model object has been stored, then select the appropriate revision from the version tree. The variogram models available in the project will be listed; select one, then click Import.
For more information on how to import and reload variogram models and other objects from Central, see Importing Data From Central
In the project tree, variogram models imported from a file and from Central are distinguished from those created in the project by their icon.
![]()