Experimental Variography and Variogram Models
Variography is the analysis of spatial variability of grade within a region. Some deposit types, e.g. gold, have high spatial variability between samples, whereas others, e.g. iron, have relatively low spatial variability between samples. Understanding how sample grades relate to each other in space is a vital step in informing grades in a block model. A variogram is used to quantify this spatial variability between samples.
In estimation, the variogram is used for:
- Selecting appropriate sample weighting in Kriging and RBF estimators to produce the best possible estimate at a given location
- Calculating the estimators’ associated quality and diagnostic statistics
In Leapfrog Energy domained estimations, variograms are created and modified using the Spatial Models folder for a domained estimation. To create a new variogram model, right-click on the Spatial Models folder and select New Variogram Model. See the Variography and Estimators topic for a description of how to manage variogram models in Leapfrog Energy.
A new variogram model is not auto-fitted and should not be assumed to be the initial hypothesis for the workflow. While some reasonable defaults have been selected for the variogram model, the geologist’s personal hypothesis should be the starting point for the estimation workflow.
Working with variograms is an iterative process.
The rest of this topic provides an overview of the Variogram Model window. Separate topics describe how to use the different tools available for working with variograms; they are the Variogram Model Controls topic and the Experimental Variogram Controls topic.
See The Ellipsoid Widget for information that is useful in working in the Variogram Model window.
The Variogram Model window is divided into three parts:

|
Variogram model controls for adjusting the variogram model type, trend and orientation. See Experimental Variography and Variogram Models below. |

|
Graphs plotting the selected variogram |

|
Experimental controls for verifying the theoretical variogram model. See Experimental Variography and Variogram Models below. |
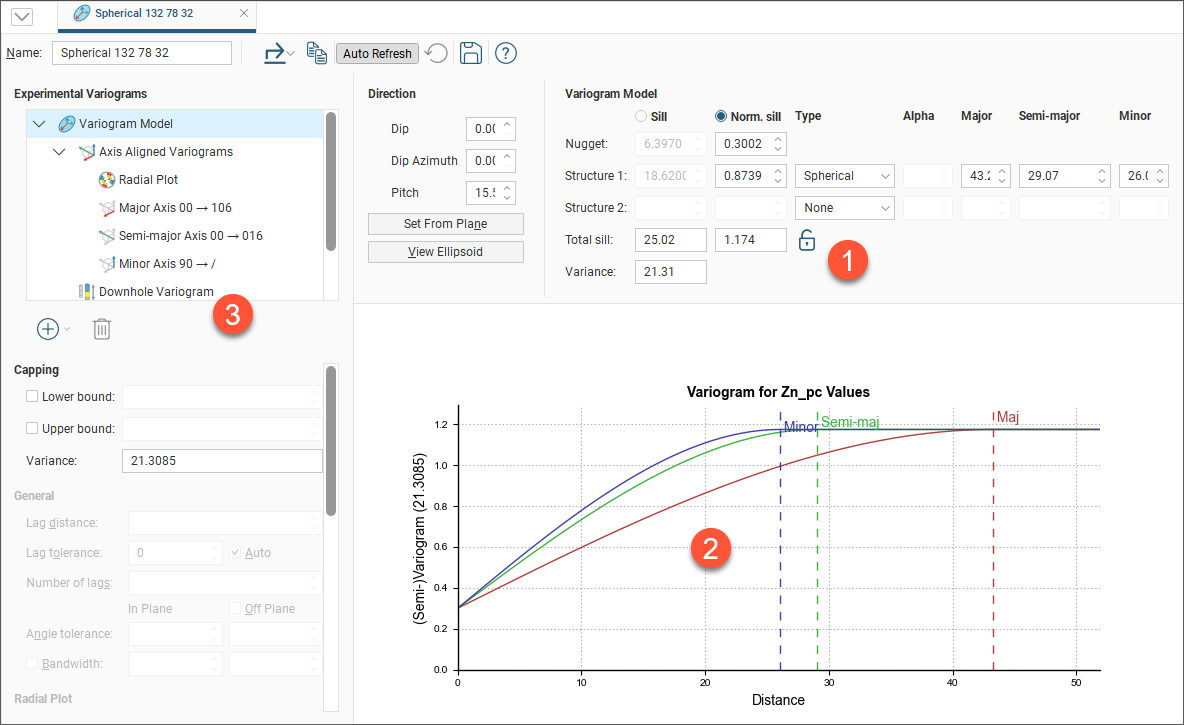
When you edit a variogram model in the Variogram Model window, an ellipsoid widget is automatically added to the scene. The ellipsoid widget helps you to visualise the variogram in 3D, which is useful in setting variogram rotation and ranges and in defining search neighbourhoods.
If the Variogram Model window is docked as a tab, you can tear the window off. As a separate window, you can move and resize the window so you can see the ellipsoid change in the 3D scene while you make adjustments to the model settings. The detached window can be docked again by dragging the tab back alongside the other tabs, as described in Organising Your Workspace.
There are two ways to save the graph for use in another application:
- Click the Export button (
 ) and select Export graph image to export the graph as a PDF, PNG or SVG file.
 - Click the Copy graph button (
 ) to copy the graph to the clipboard. You can then paste it into another application.
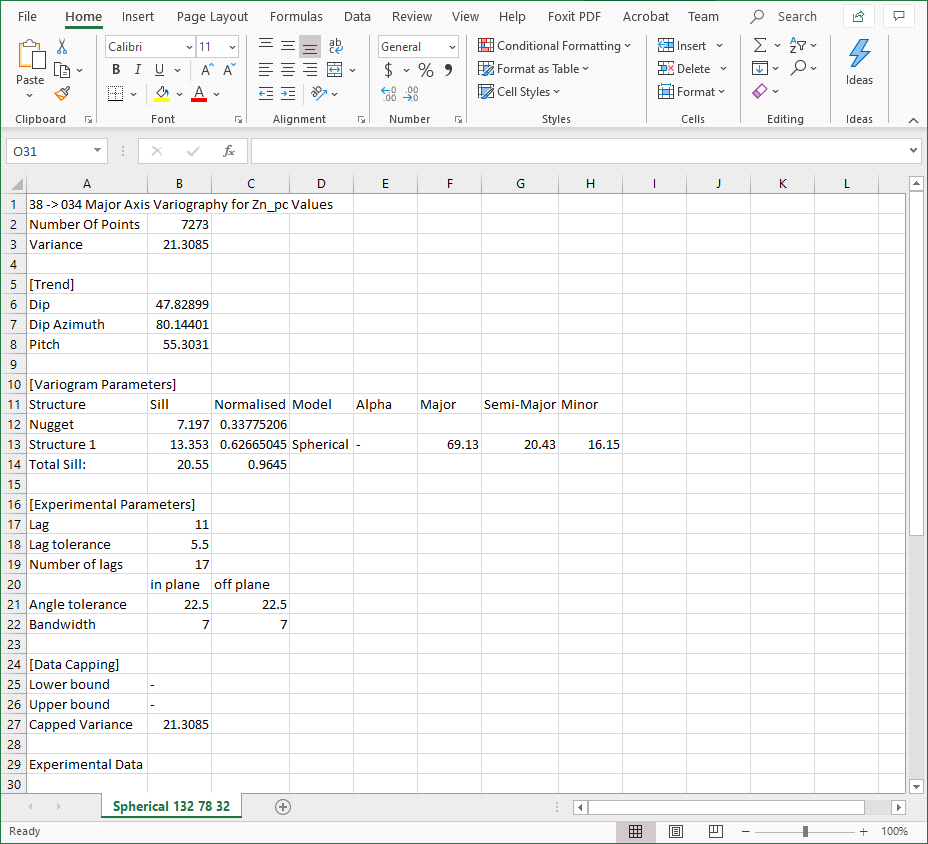
Additionally, you can save variogram parameter data by selecting a theoretical variogram from the list, clicking the Export button (![]() ) and selecting Export data from the options. Note that Export data is not available for the experimental variogram or the Radial Plot.
) and selecting Export data from the options. Note that Export data is not available for the experimental variogram or the Radial Plot.
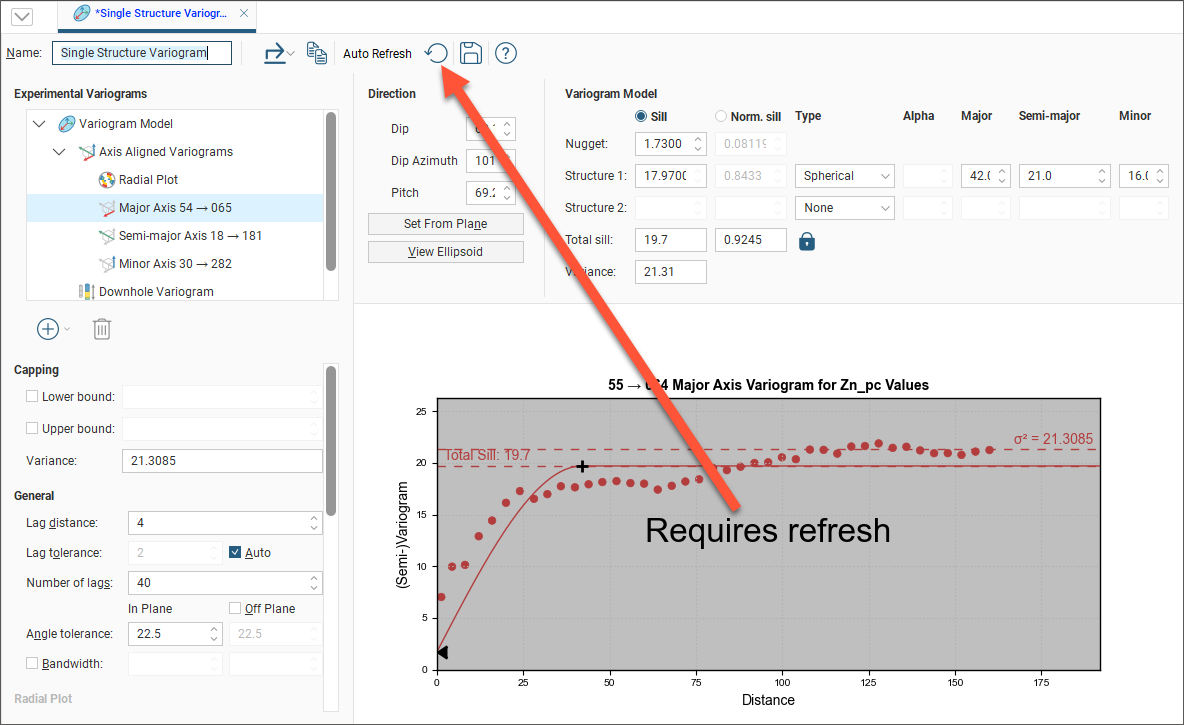
There are two buttons for refreshing the graphs when changes are made:
- When Auto Refresh is enabled, recalculations will be carried out each time you change a variogram value. This can produce a brief lag.
- When auto refresh is disabled, you can click the Refresh button (
 ) whenever you want the graphs to be updated. This is the best option to use when working with a large data set.
If auto refresh is disabled and values have been changed without the graphs being updated, the chart will turn grey and a reminder will be displayed over it: