
Saved Statistics
Leapfrog Energy has a number of tools that help you to statistically analyse your data. This topic describes the Saved Statistics object, which collates and organises charts and tables you have defined for data in the project. It is divided into:
Leapfrog Energy uses fixed 25%/75% quartiles.
Creating a Statistics Report
For many of the data tables, charts and tables of statistics present statistical information about the data set. To create one of these statistics reports, right-click on a data table; if the data type has associated statistics options, the menu will include a Statistics option.
When that Statistics option is selected, a window will appear where the statistics type can be chosen:
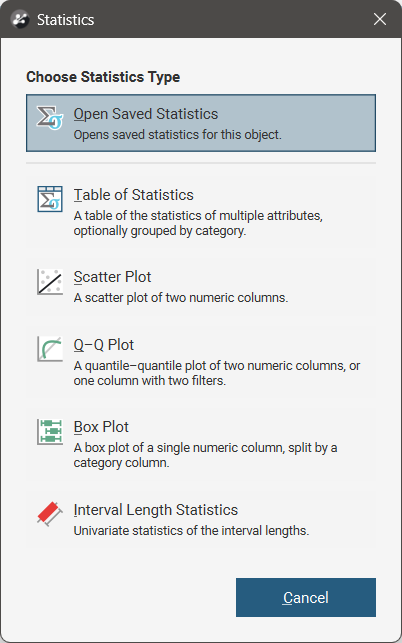
The button at the top of the window is Open Saved Statistics; this will open a window with a collection of the already saved statistics for the current data object. If there are no saved statistics for the data object, the button will be greyed out.
The options available for creating statistics reports will depend on the current data type. Selecting an option opens a new statistics window. Separate topics describe the different statistics visualisations available in Leapfrog Energy:
When you have customised the statistics report to your liking, click the Save button (![]() ) to add the report to the list of statistics reports in the Saved Statistics folder.
) to add the report to the list of statistics reports in the Saved Statistics folder.
Note that saving a statistics report to the Saved Statistics folder creates a copy of the open report and switches to displaying the saved copy. You can then modify the name of the saved report so you can more easily find it in the Saved Statistics folder.
You can also switch back to the original report and make further changes, then save additional versions of the report to the Saved Statistics folder.
Managing Saved Statistics Reports
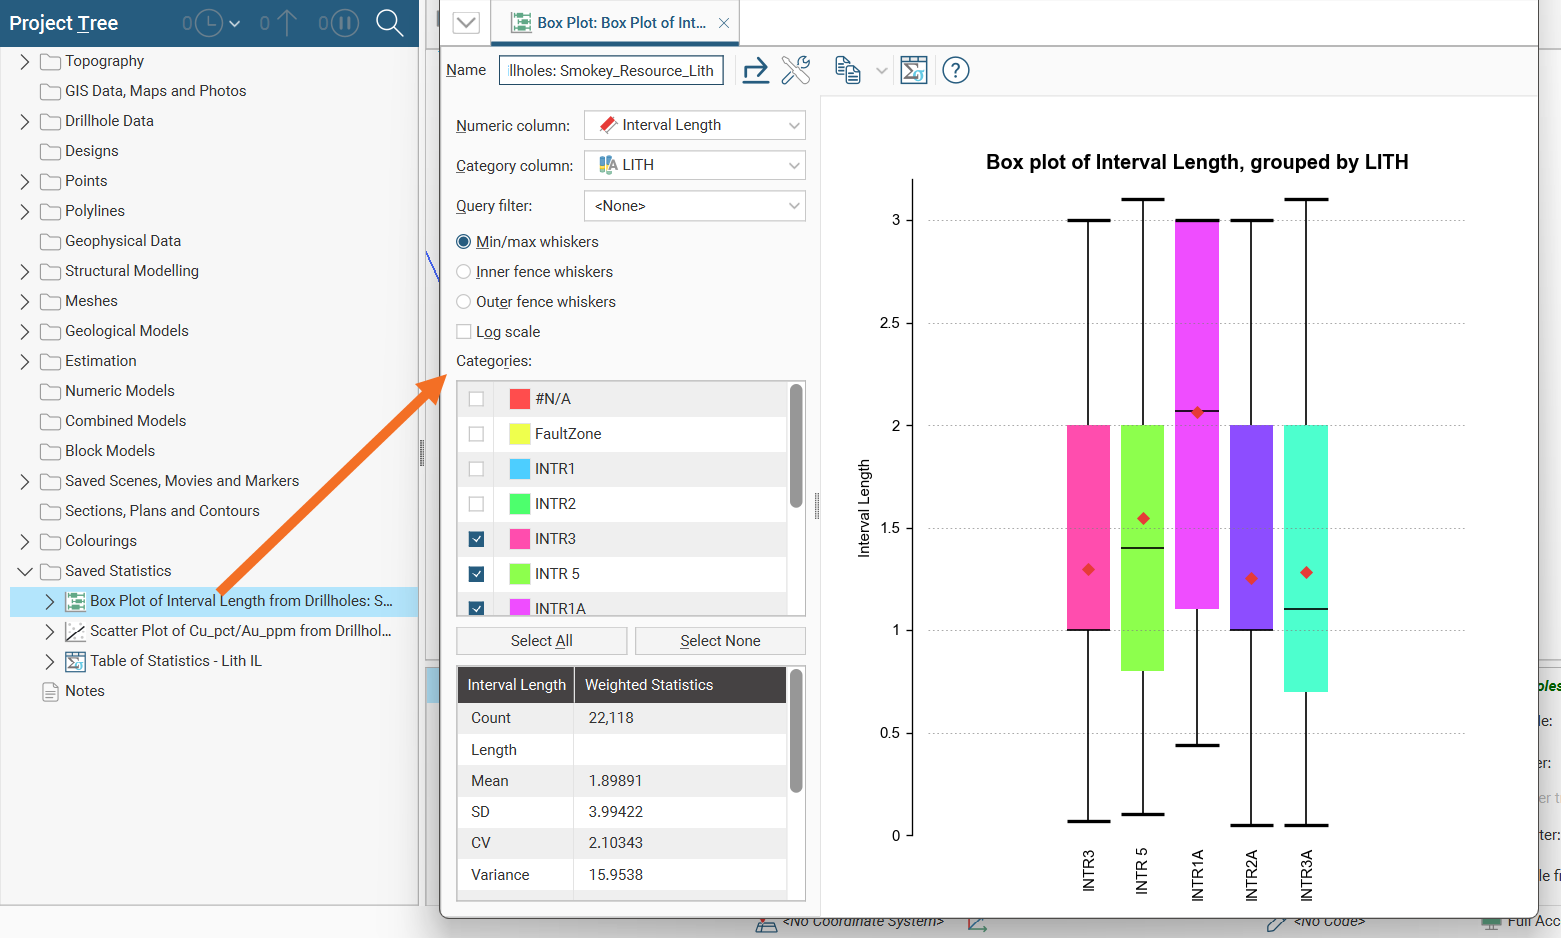
The Saved Statistics folder in the project tree contains charts and tables you have defined for data in the project. These can be organised into sub-folders. Each saved statistics report will also have a link to its source data object.
Each of the statistics objects in the Saved Statistics folder can be opened and will appear as a detachable tab.
For more information on working with detachable tabs, see Organising Your Screen Space.
Any changes you make to the open statistics object will automatically be preserved.
You can open multiple saved statistics reports in a folder by right-clicking on the folder and selecting Open Saved Statistics in New Window. A window will open that has an individual detachable tab for each statistics report in the folder.
You can multi-select saved statistics in the project tree, right-click on the selection, and select Open in New Window. A window will open that has an individual detachable tab for each selected statistics report.
The Open option will also open the selected statistics reports, but will follow the rule for new tabs specified in Settings > User Interface > New tab position. See New Tab Position for more information.
To learn how to add statistics reports to the statistics folder, see Creating a Statistics Report.
To delete a statistics report from the project tree, right-click on a statistics object and select Delete from the menu.
Exporting Saved Statistics
Each individual statistics report has an Export button (![]() ) for saving the chart in PDF, SVG or PNG file formats.
) for saving the chart in PDF, SVG or PNG file formats.
You can also bulk export saved statistics reports by right-clicking on the Saved Statistics folder or any subfolder and selecting Export Graphs.
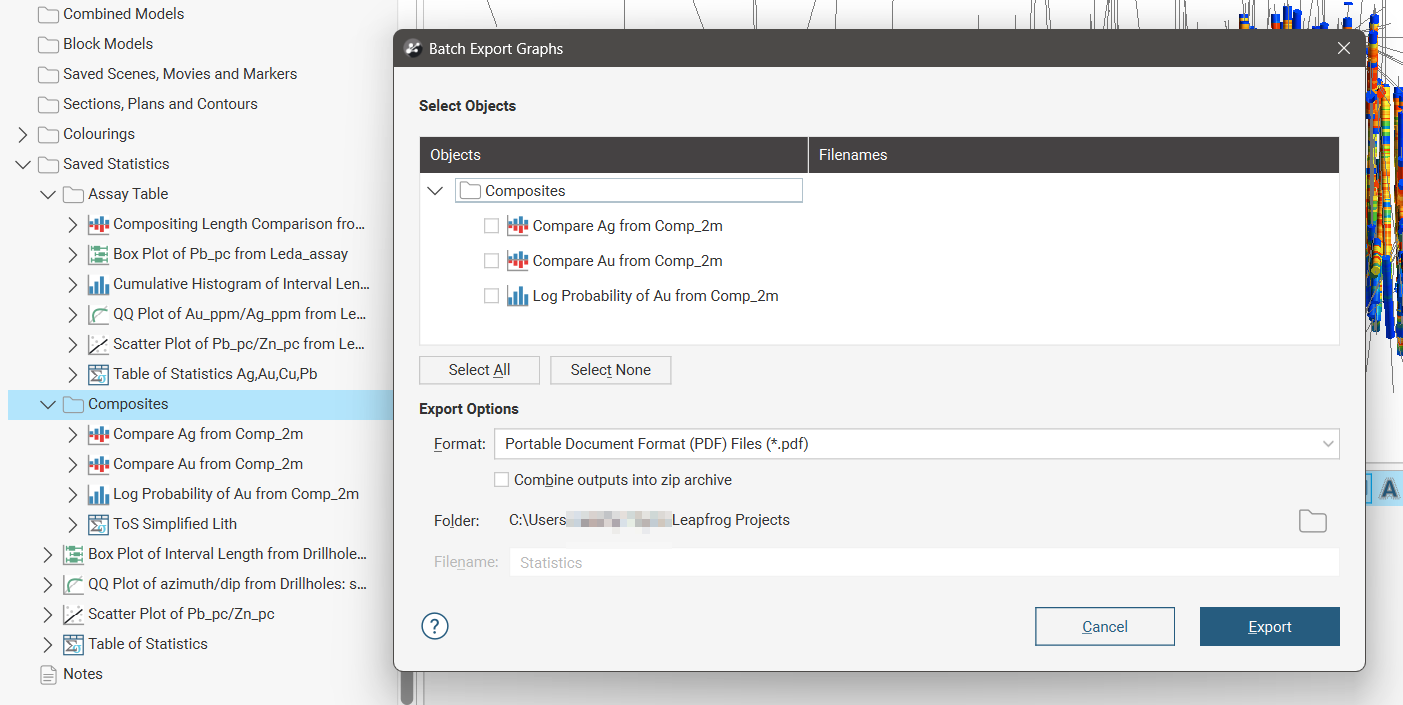
In the Batch Export Graphs window, the Select Objects list will include all the charts in the selected folder.
Tables of statistics will not be included in batch exports.
Select any of the statistics reports you wish to have included in the export. There are Select All and Select None buttons to assist.
Selected objects are given a default filename that is the same as the object, but this can be modified in the Filenames column, if required.
Choose the Format for the files to be exported and the Folder location. There is also an option to Combine outputs into zip archive that will produce a single *.zip file with the given Filename containing all the exported reports.