
Spatial search
On the Data page, you can view geoscience objects projected onto a map. Spatial search shows all geoscience objects in workspaces you have permissions for, if those objects contain Coordinate Reference System (CRS) information. This is useful in understanding what data is available in a region of interest.
The map displays geoscience objects projected using WGS84. Projected objects retain their original CRS information.
This topic describes how to use the map and find more information about the geoscience objects you have access to. It is divided into:
- Navigating on the map
- Changing the map’s base layer
- Displaying GeoJSON files
- Viewing object details
- Zooming to extents
- Opening an object in the 3D Viewer
While working with the map, you can work with or without the workspaces list displayed. To work with only the map displayed, click the Map button:
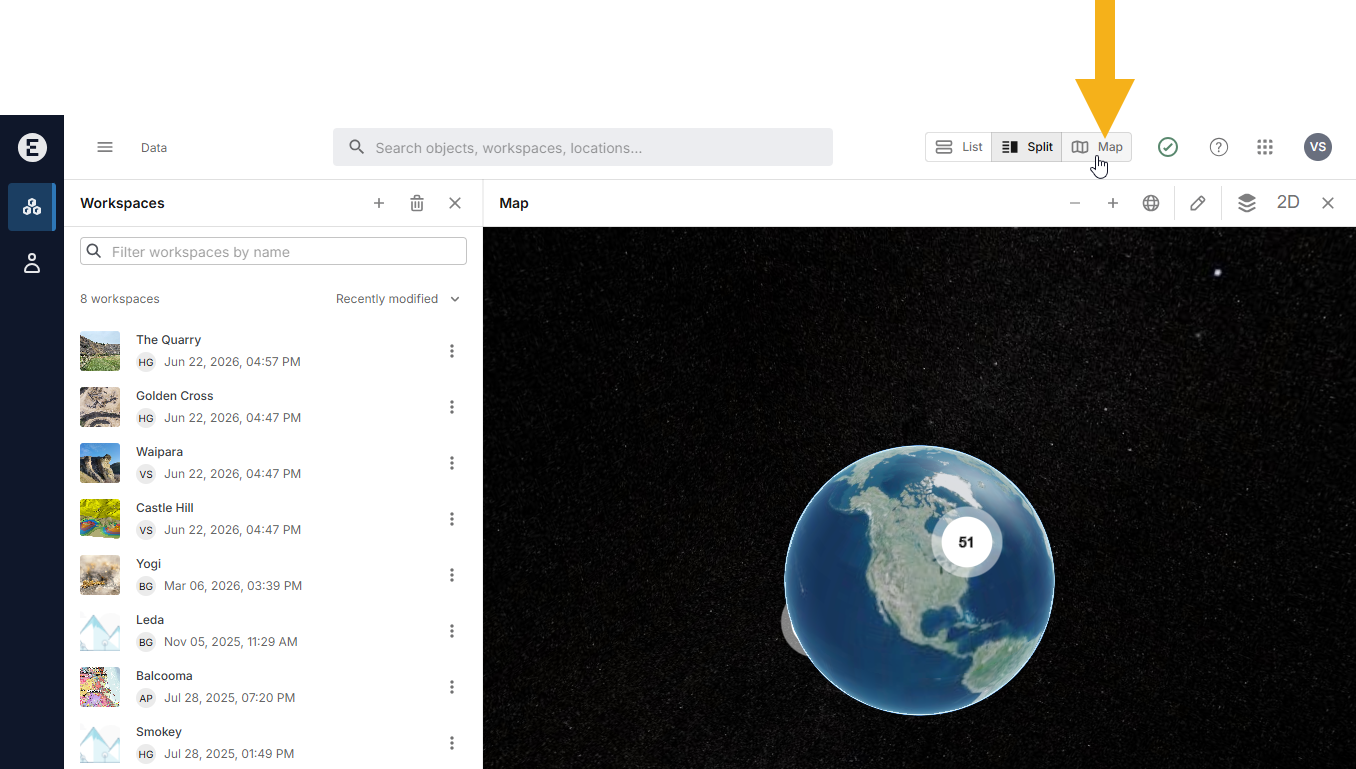
Clicking the Split button restores the combined workspaces/map view.
Navigating on the map
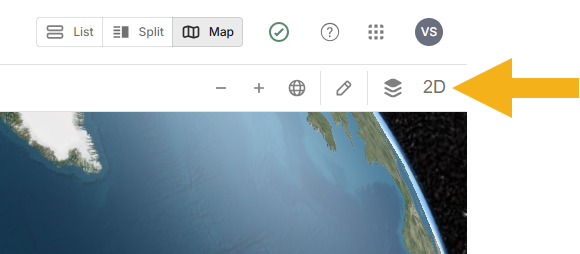
The map starts zoomed out showing the total number of geoscience objects stored in your workspaces, organised by location. You can work in 3D, with the earth displayed as a globe or in 2D, with the earth displayed as a flat map. If your workspaces are in different locations around the world, the 2D view may be more useful for getting an overview of the geoscience objects in your workspaces.
To switch between the 3D and the 2D views, click the button underneath the user ID button:
In both views, zooming in and out of the map and panning use the same mouse actions:
- To zoom in and out, use the scroll wheel or hold the right mouse button while dragging.
- To pan, click and hold both mouse buttons while dragging.
Rotating the view is different for each view:
- In the 3D view, rotate by holding the left mouse button while dragging.
- In the 2D view, rotate by holding the scroll wheel while dragging.
Changing the map’s base layer
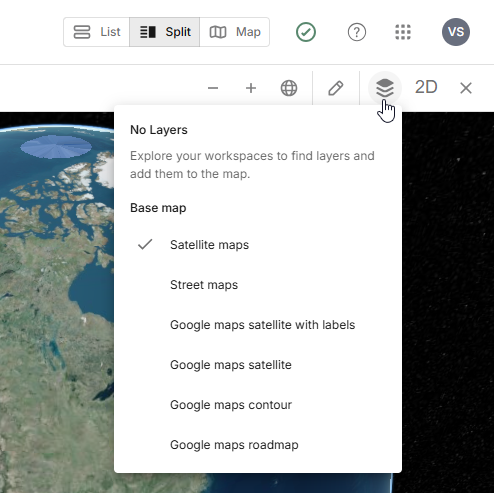
A number of different base layers are available for the map so you can view your data against the base map most relevant to your work. Choose the base map you wish to use from the layers menu:
Displaying GeoJSON files
If a workspace contains GeoJSON files, these can be displayed on the map, which can be useful in providing context for other data.
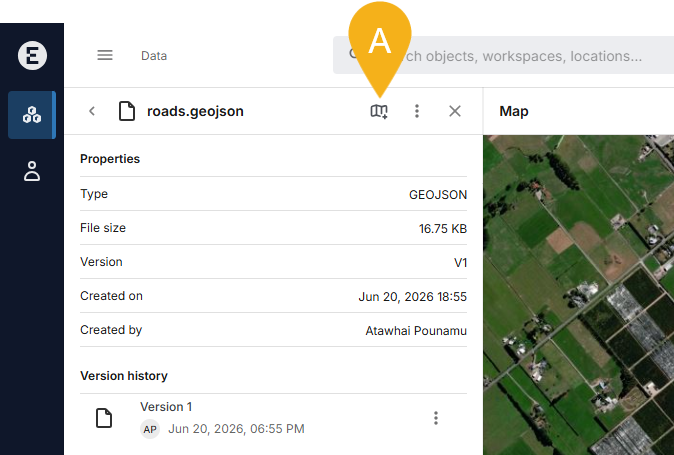
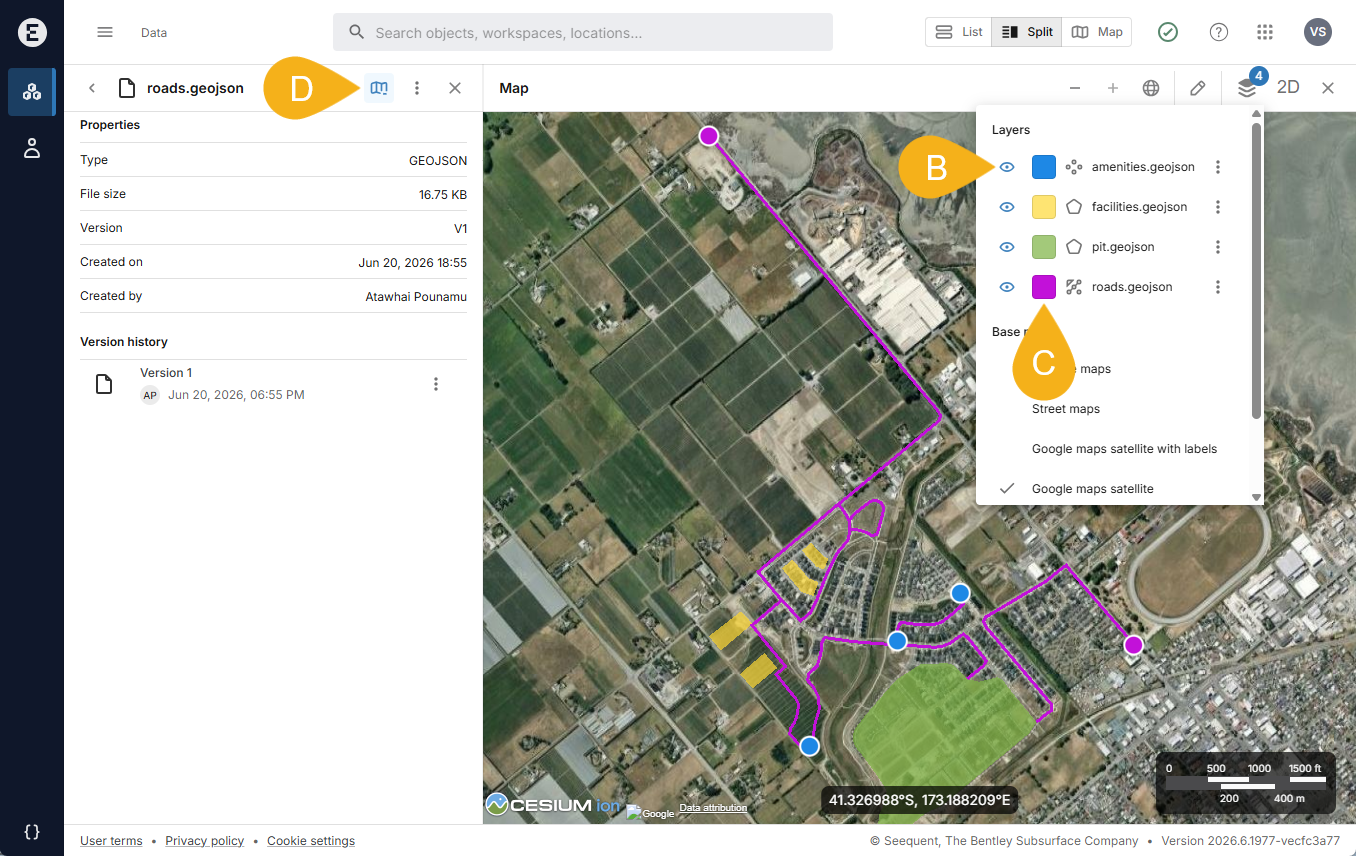
Because GeoJSON files are not geoscience objects, they will not be displayed on the map as part of the total object count. To display GeoJSON files, open the workspace containing the GeoJSON files and click on the file you wish to display on the map. In the details panel, there is a button (A) for GeoJSON files that will add them to the map:
For example, here a number of GeoJSON files are displayed on the map. You can:
- Adjust the view for each layer using the visibility button (B).
- Change the colour and opacity for the layer by clicking the colour chip (C).
- Remove a layer by clicking the map button (D) for that layer.
Viewing object details
Viewing an object’s details displays the same object information that is displayed when browsing through the workspaces list.
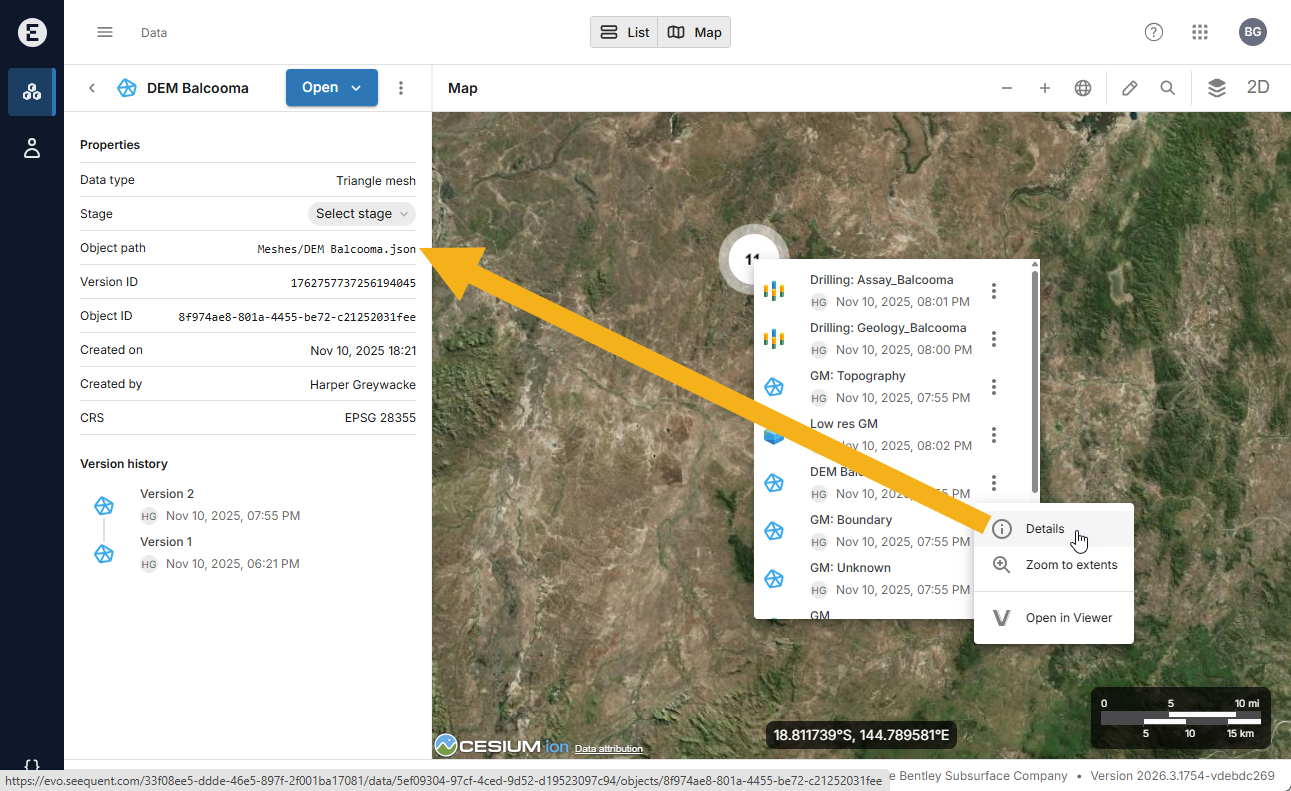
See Viewing more information about objects in the Geoscience objects topic for more information.
Zooming to extents
Clicking on an object in the list displays its extents as a shaded box, as is shown here for the DEM Balcooma mesh:
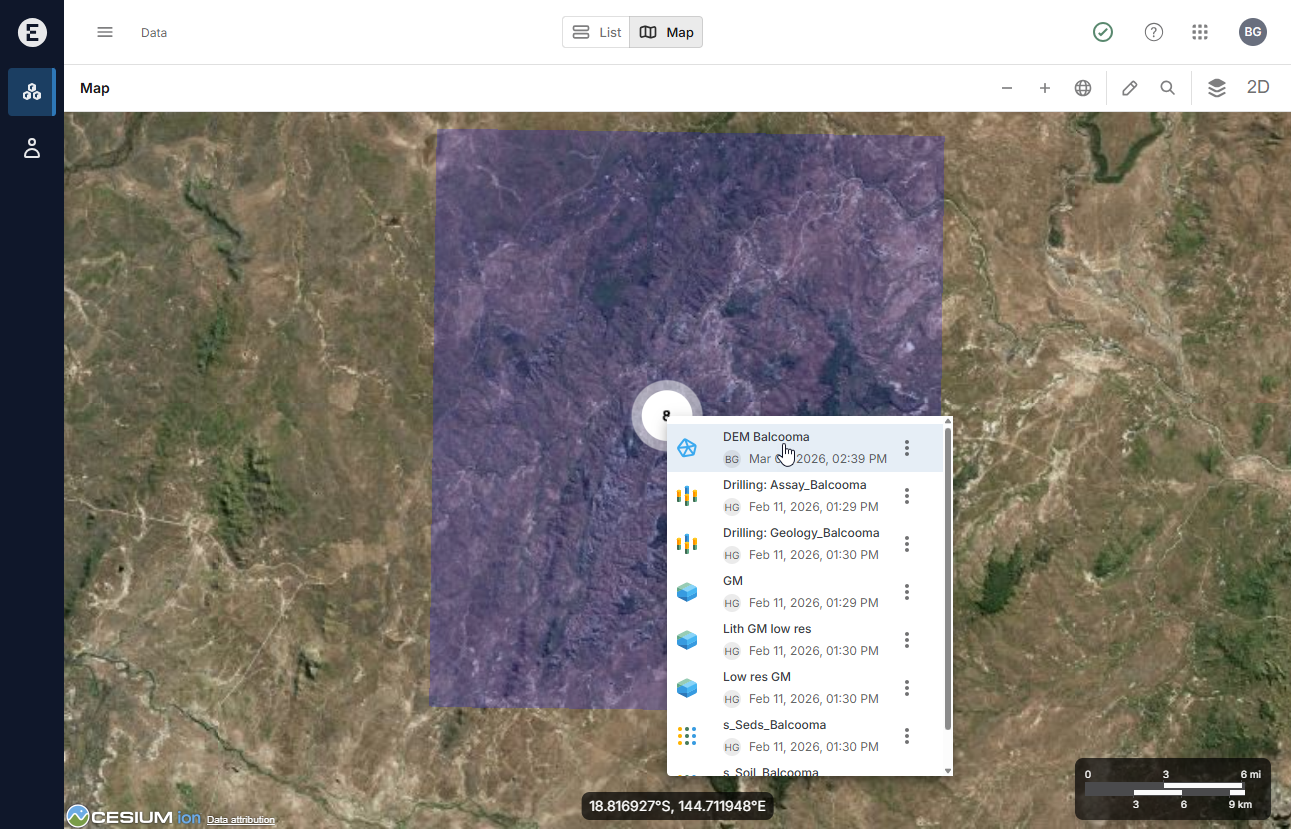
If the object’s extents are not apparent, it can be because you are zoomed out too far or in too close. Click on the object’s overflow menu and choose Zoom to extents to get a clearer view of the object and its extents.
Opening an object in the 3D Viewer
From the map, you can open an object in the 3D Viewer. To do this, choose Open in Viewer from the object’s overflow menu. This opens the workspace the object belongs to in the 3D Viewer. The selected object is displayed (A) and you can add further objects from that workspace to the scene from the Objects list (B):
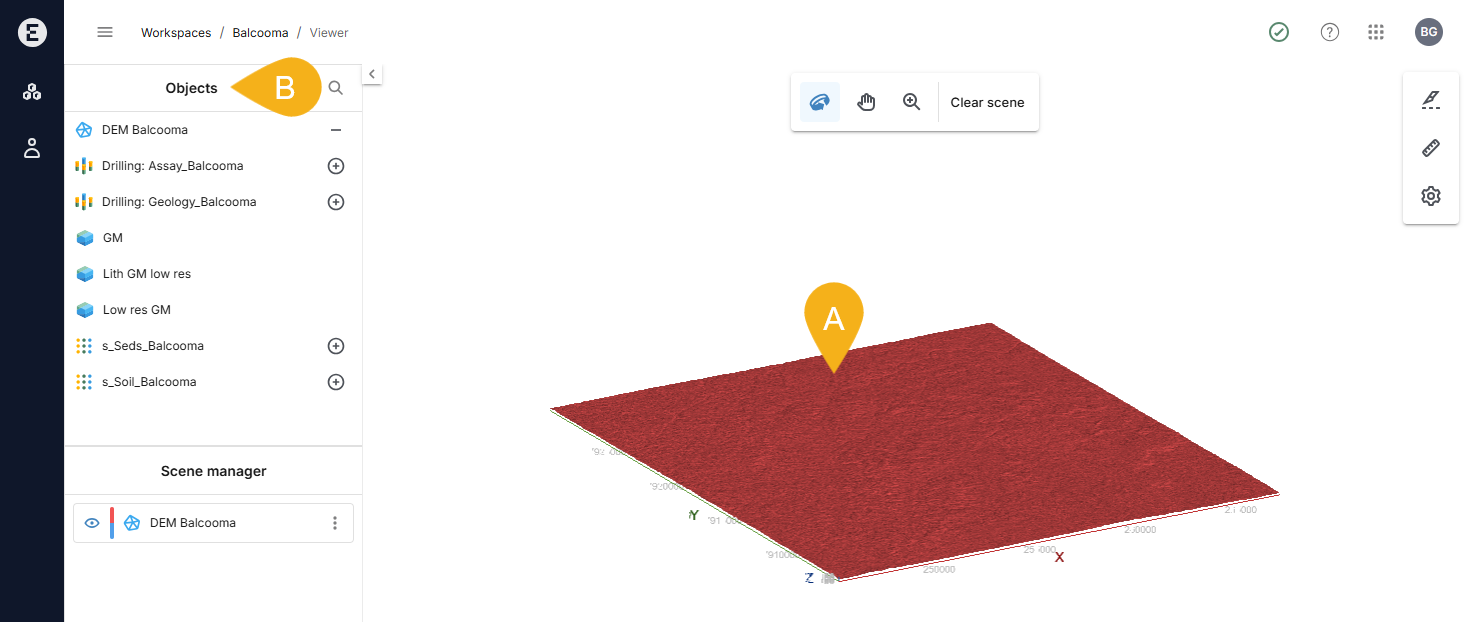
See the 3D Viewer help for detailed information on displaying geoscience objects.