
Analysing Data
Leapfrog Geo has a number of tools that help you with analysing your data:
General Data Tools
The Properties Window
The most basic information about an object is contained in the object’s Properties window, which is specific to the type of object. Right-click on the object in the project tree and select Properties:
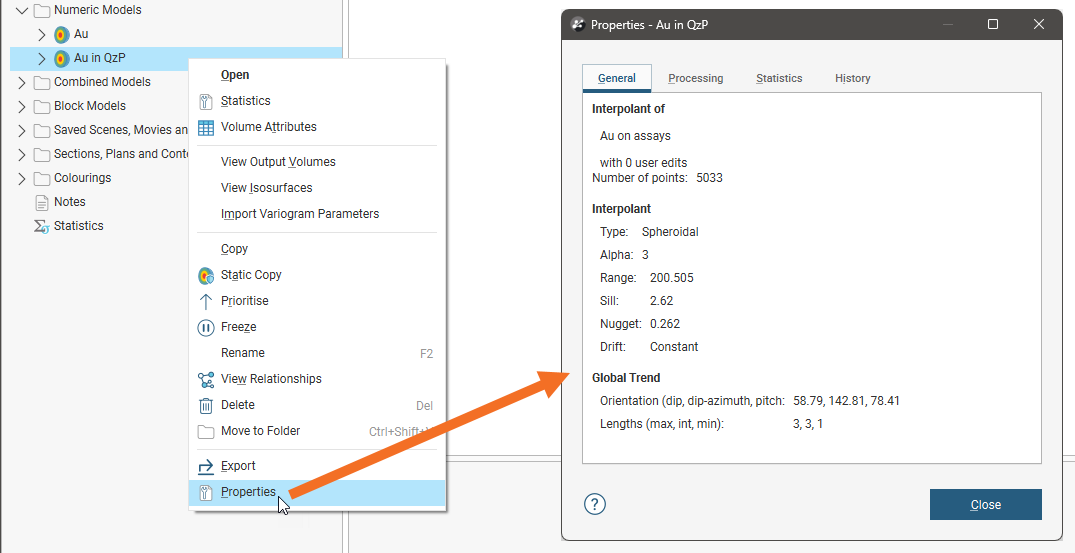
See the Viewing Object Properties topic for more information.
Visualising Data
Visualising data using the shape list and the shape properties panel is an important part of interpreting and refining data and making modelling decisions. The tools available depend on the type of object being displayed, and many objects can be displayed evaluated on other objects.
Another useful tool in analysing the data displayed in the scene is the Scene Details panel, which shows more detailed information about a data objects clicked on in the scene:
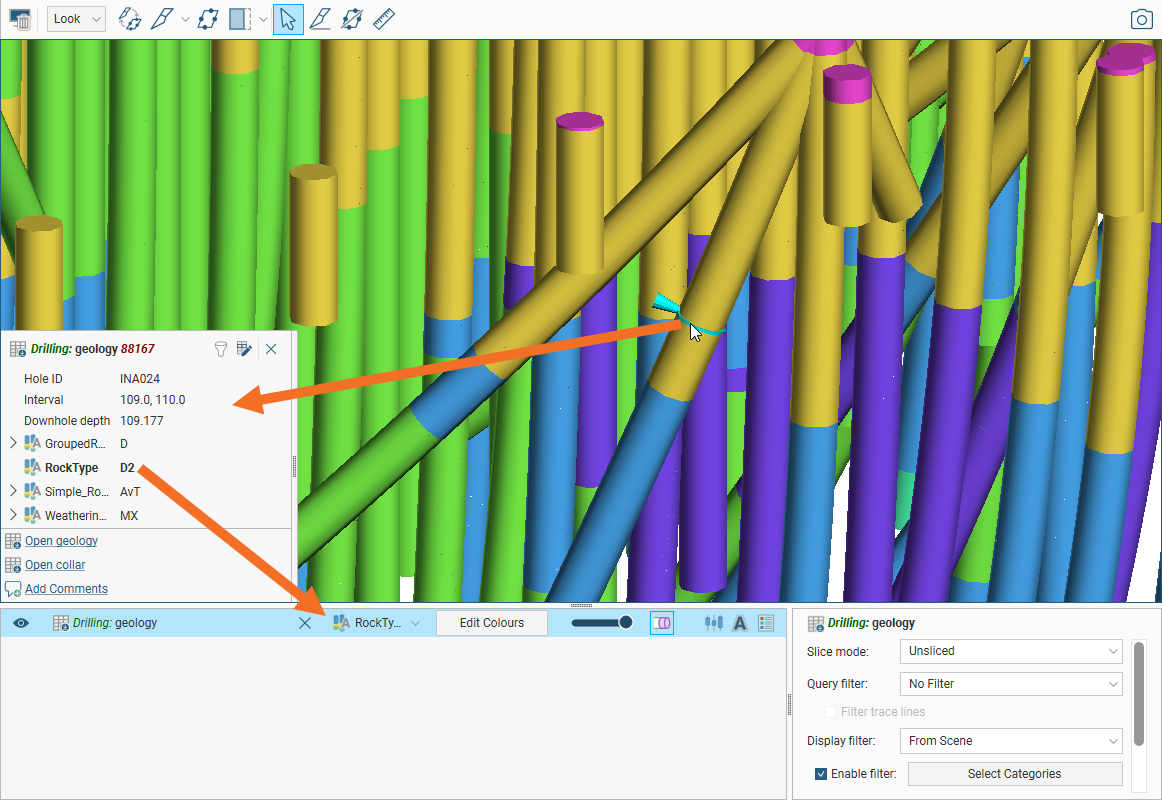
See the following topics for more information:
Statistics Tables
For many data tables, you can view a table of statistics for multiple attributes. To do this, right-click on a table in the project tree and select the Statistics option. A window will appear showing you what statistics tables are available for that table:
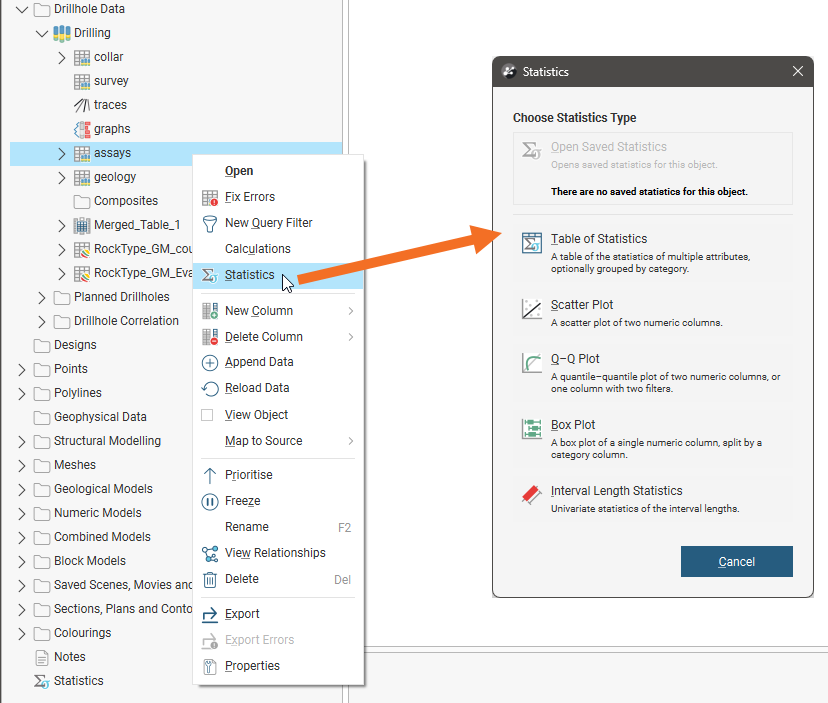
See the Statistics topic for more information.
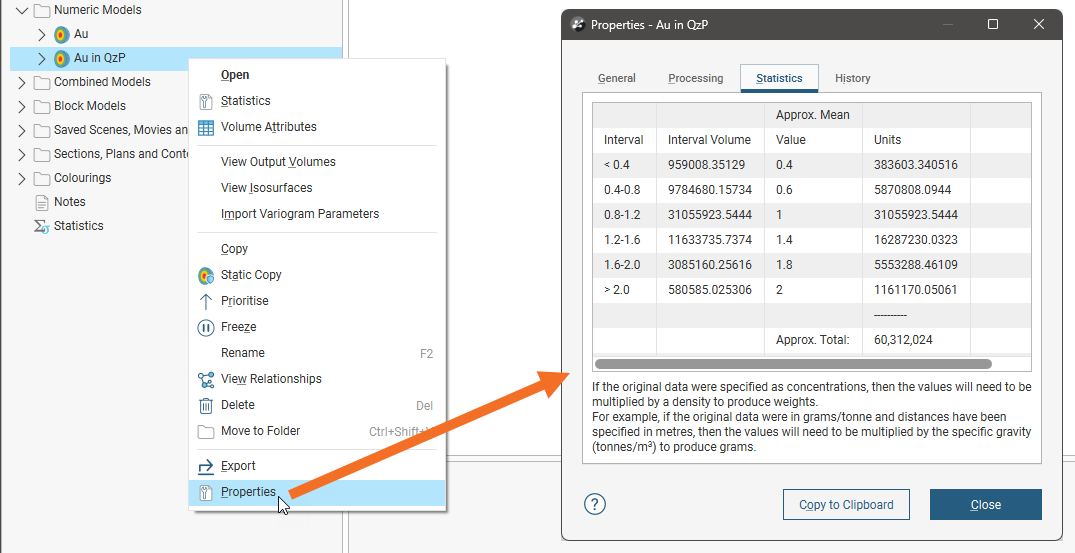
Some data objects have additional statistics information in their Properties windows. For example, here the Properties window for an interpolant includes a Statistics tab:
Structural Data Tools
Stereonets
Stereonets are useful for visualising structural data and identifying trends in 2D. Errors in categorisation of structural data can also become apparent when the data is viewed on a stereonet.
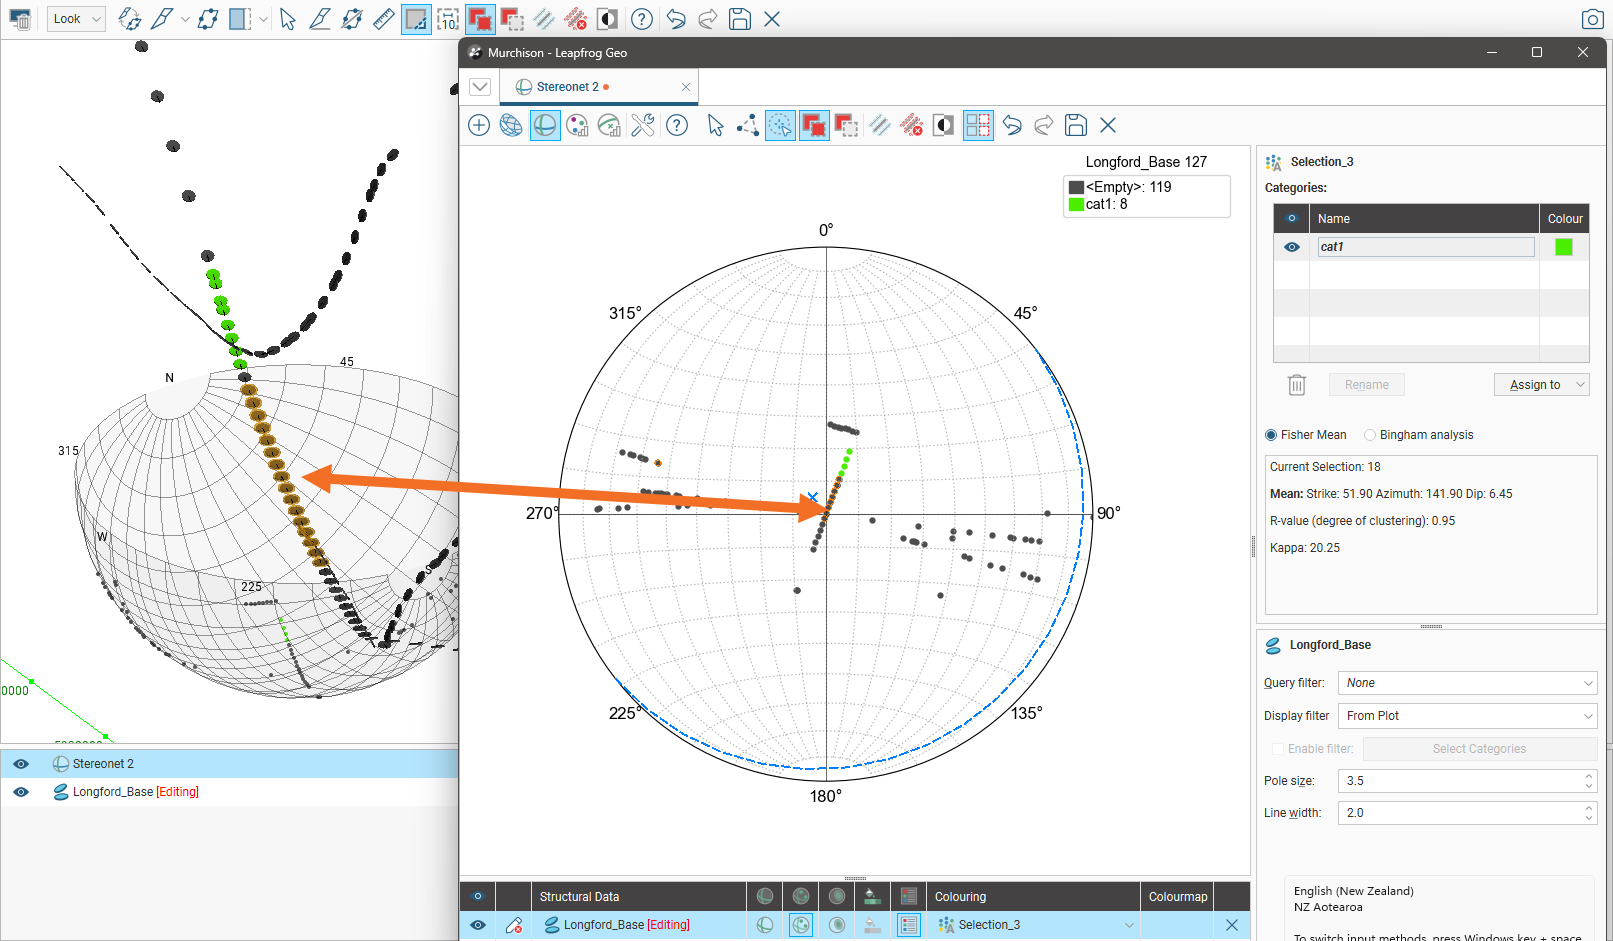
See the Stereonets topic.
Form Interpolants
Form interpolants are useful for visualising structural data and identifying broad trends in 3D. The form interpolant’s meshes can then be used to control other surfaces in the project.
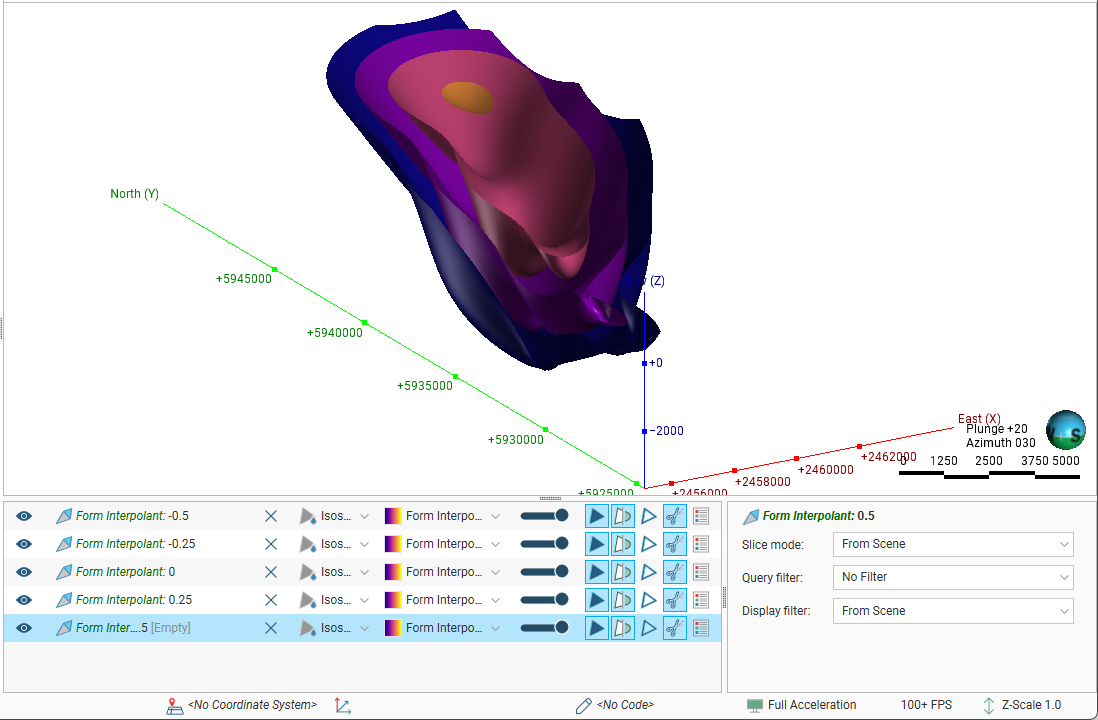
See the Form Interpolants topic.
Drilling Data Tools
Drillhole Correlation
With the drillhole correlation tool, you can view and compare selected drillholes in a 2D view. You can then create interpretation tables in which you can assign and adjust intervals and create new intervals. Interpretation tables are like any other interval table in a project and can be used to create models.
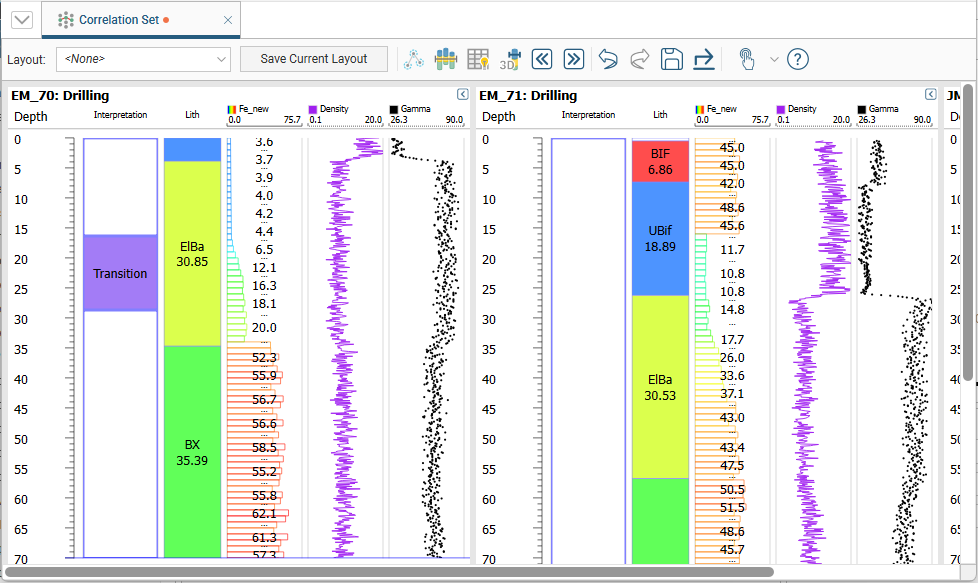
See the Drillhole Correlation Tool topic.
Drillhole Planning
You can plan drillholes, view prognoses for models in the project and export planned drillholes in .csv format.