Comparing Local Columns and BlockSync Columns
When you first import a BlockSync model into Leapfrog Geo, the columns in the project match the BlockSync columns. Once you map local models and calculations to the BlockSync columns, differences start to emerge as your work results in new values being calculated in the mapped columns. Understanding these differences is vital to ensuring you only change the intended parts of the BlockSync model when you publish your updates.
When local columns are first mapped to a local copy of a BlockSync model, as described in Mapping Models and Calculations to BlockSync Columns, tools for visualising these differences are added to the project tree:
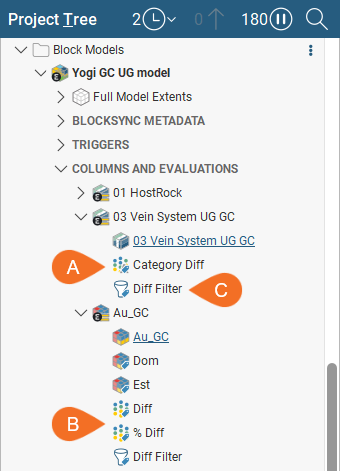
They are:
- Diff columns (A and B), which are attributes that can be displayed in the scene. For category data, a simple same/different comparison is displayed, whereas for numeric data, differences can be displayed numerically or by percentage. These Diff columns are updated whenever changes are made locally and when the model is reloaded from BlockSync.
- The Diff Filter (C) acts as a query filter on the block model and can be used in visualising data in the scene and as part of any statistics analysis or calculation. The filter can also be applied when you publish your changes, ensuring that you publish only the data that has changed. This is discussed further in the Publishing Updates to BlockSync topic.
The rest of this topic describes how to use these tools in understanding how changes you have made locally compare to the BlockSync model. It is divided into:
Displaying block models in the scene on the slicer is useful for visualising differences, especially the 2D slice mode. For more information on displaying block models using the 2D slice, see Displaying a Block Model in the Block Models topic.
Visualising Changes in Category Columns
As with any data column, Category Diff columns can be dragged into the scene from the project tree or can be selected from the shape list. Here a block model is displayed in the scene sliced, along with vein segments whose edits have resulted in changed to the model and the vein itself. The block model is displayed using a geological evaluation; display the category diff column for that evaluation by clicking on it in the shape list:
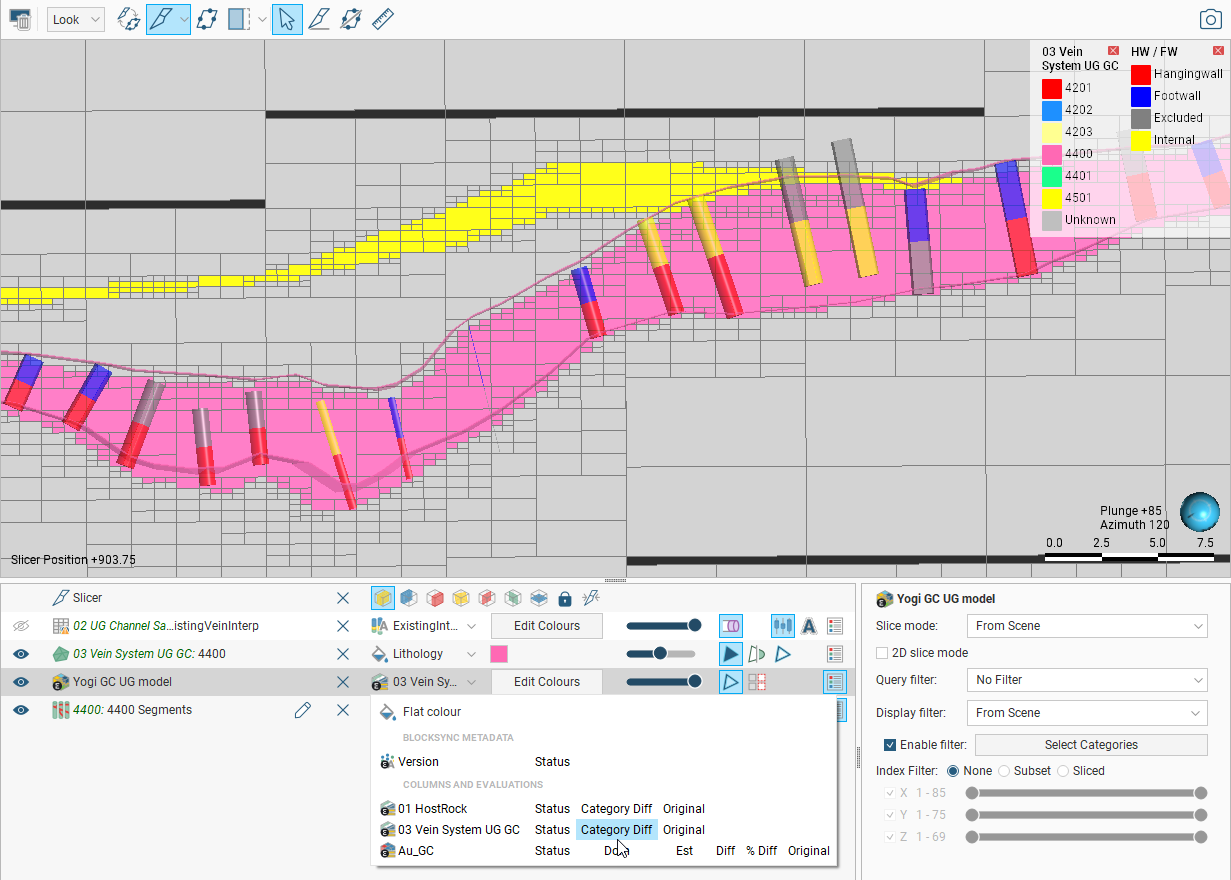
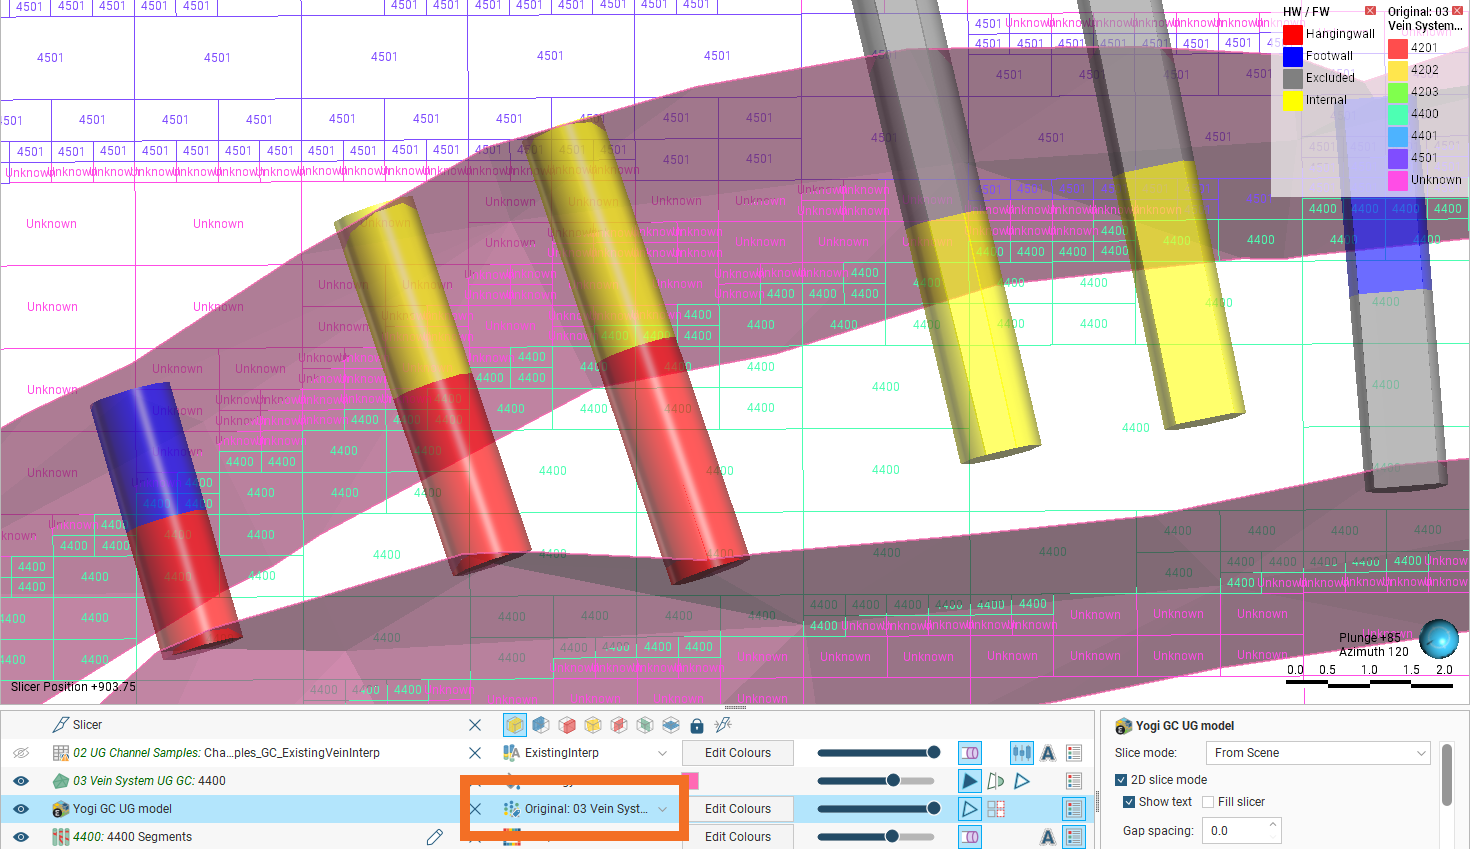
The Original column displays the categories from the BlockSync model.
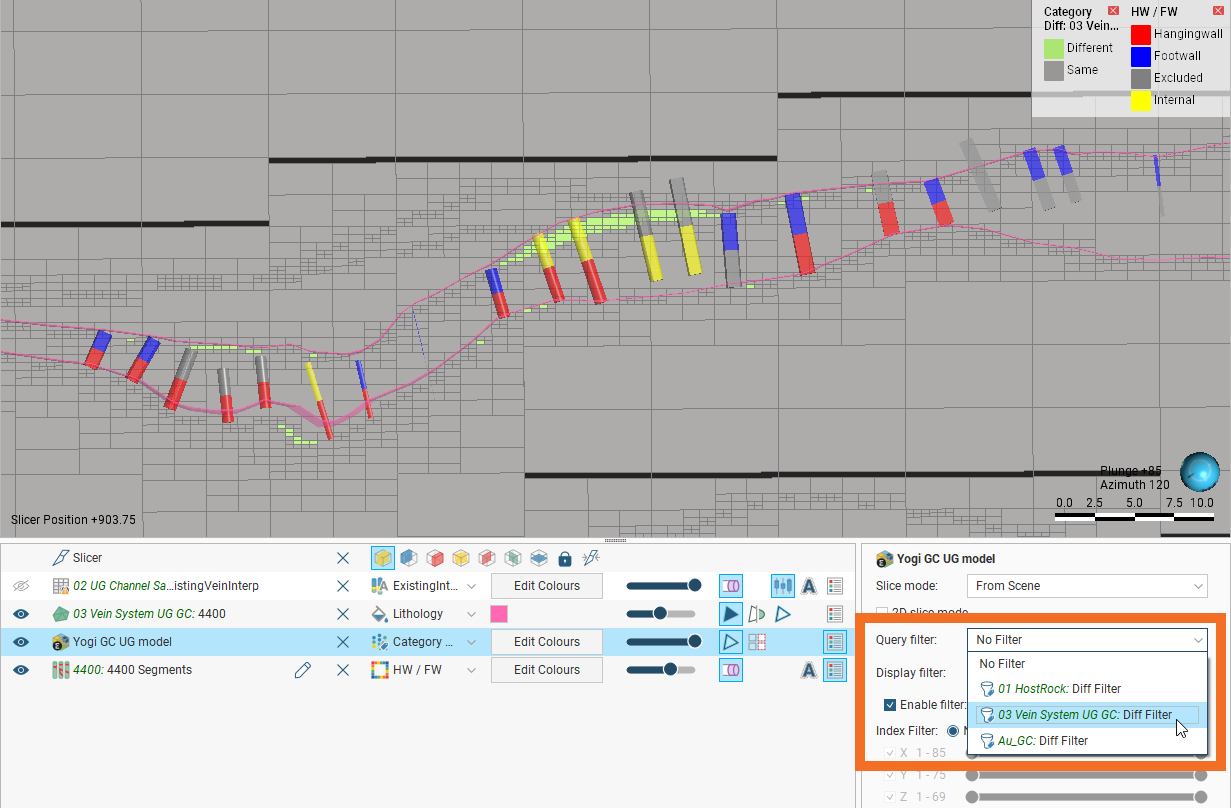
When the Diff columns for category data are displayed in the scene, blocks are shown as Different (in green) or Same (in grey):
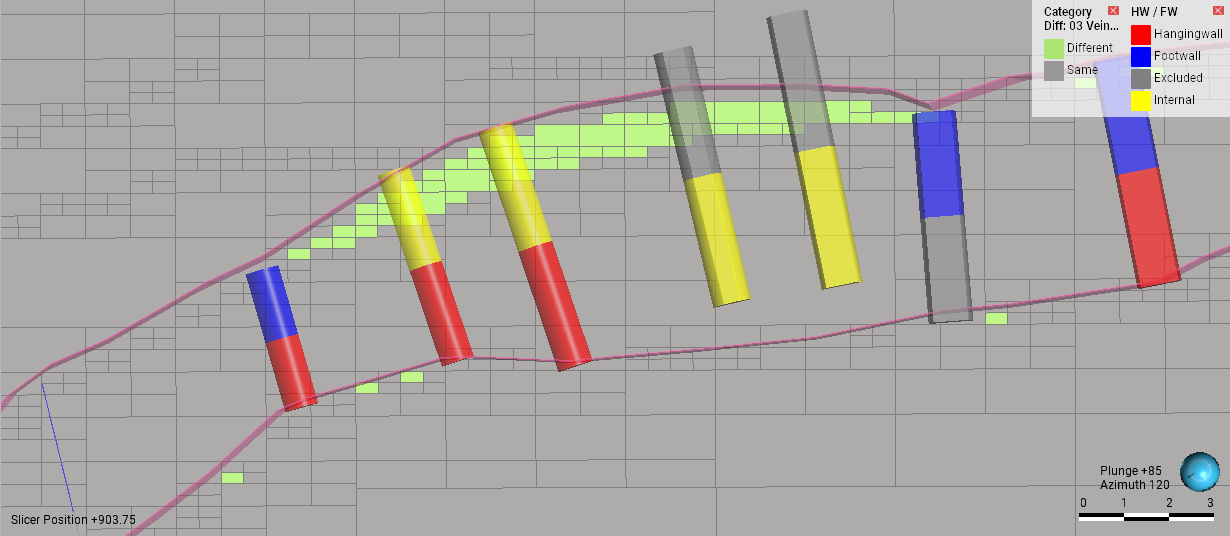
When zooming out, the Diff Filter can be useful in making changes easier to see:
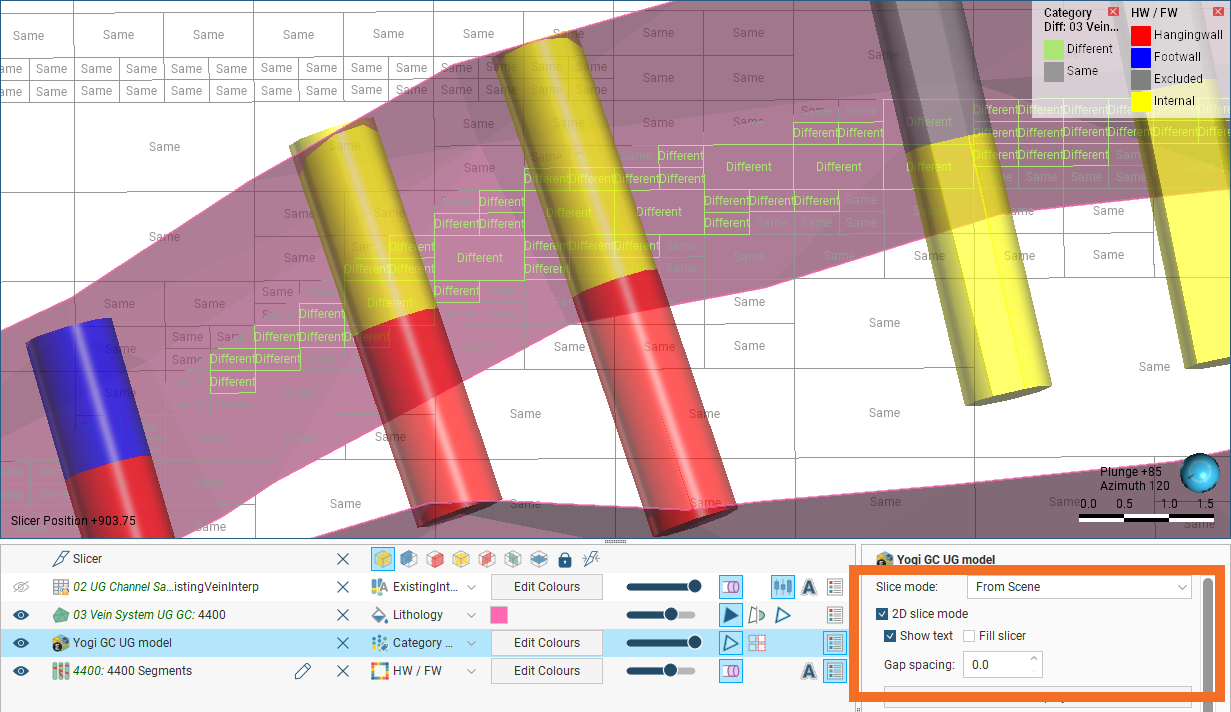
When using 2D slice mode, enable Show text to display the Different/Same labels in the scene:
The Original filter displays the original values from BlockSync:
Visualising Changes in Numeric Columns
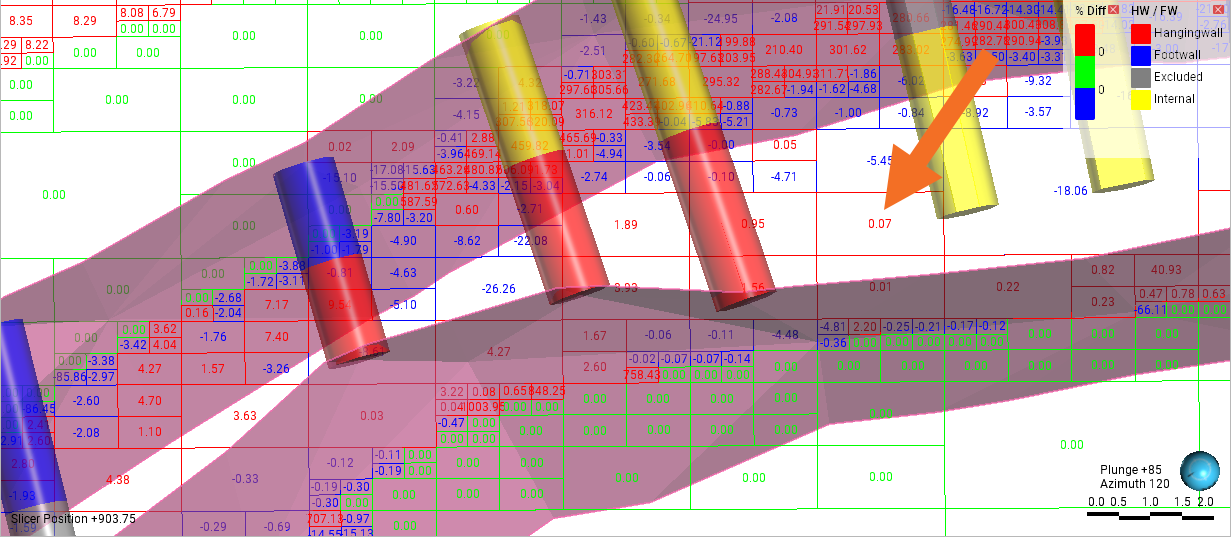
When displaying numeric data columns on a block model, differences can be displayed numerically or as a percentage. Here the block model is displayed in the scene sliced, which can be useful for seeing the changes in context:
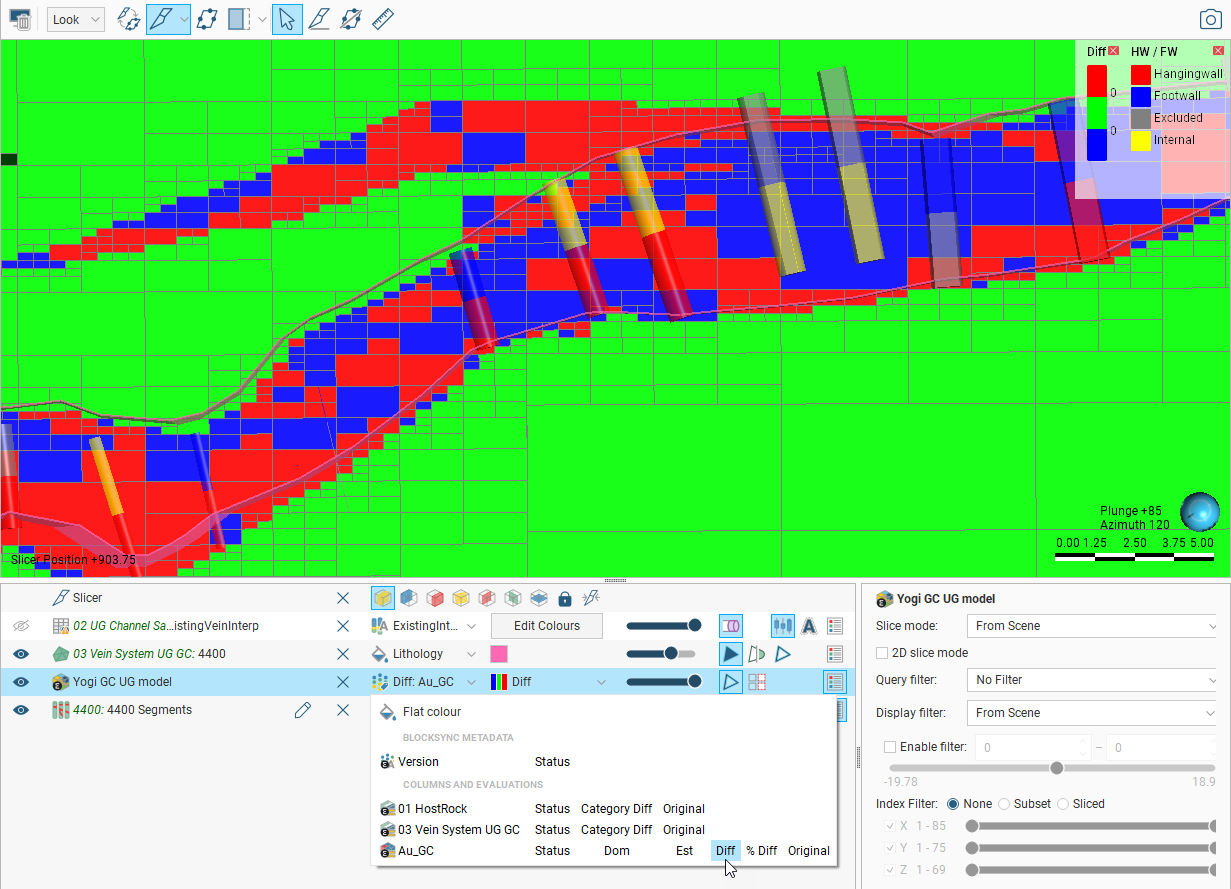
Blocks with increased values are displayed in red, those with decreased values are in blue and unchanged blocks are in green.
When using 2D slice mode, enable Show text to display the values/percentages:
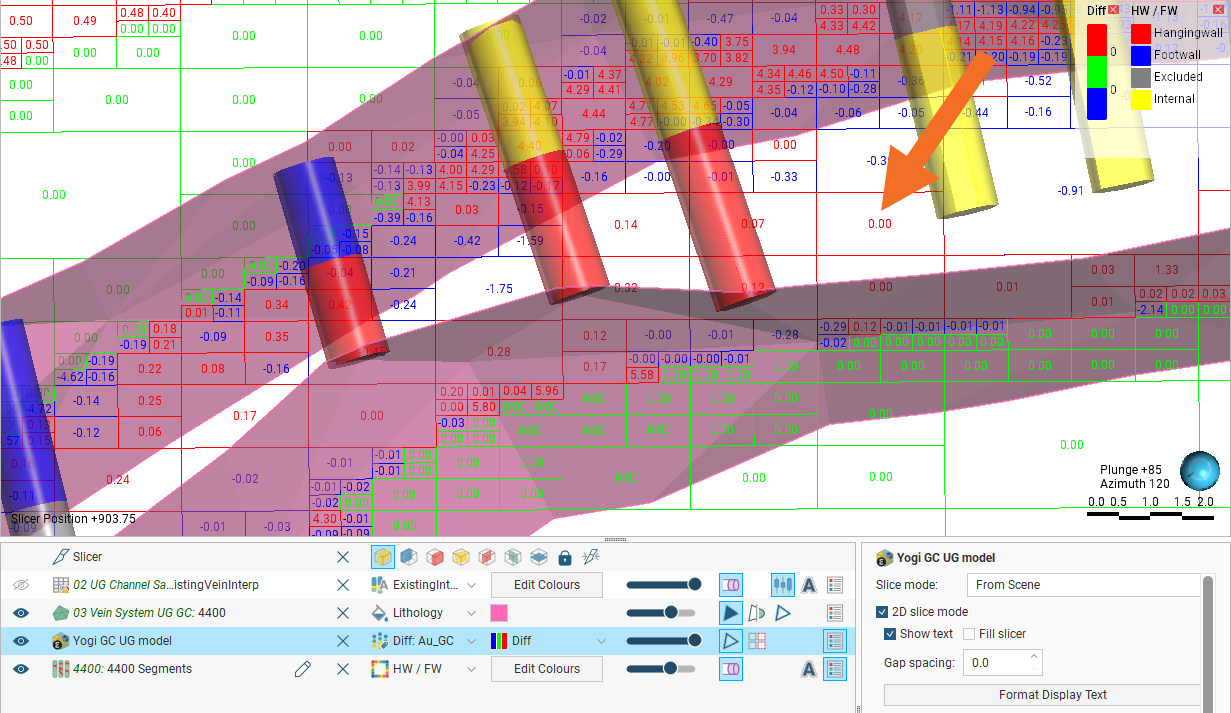
In cases where the block is blank in BlockSync, no information will be displayed.
Be aware that when using the numeric diff column some changed blocks will show 0.00; this is because numeric values are displayed to two decimal places. Switching to the percentage diff column will provide more information: