The Shape List and Shape Properties Panel
Once objects have been added to the scene window, they will appear in the shape list, which can be treated as a working set of objects:
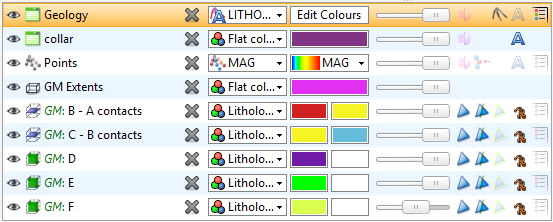
You can use controls in the shape list and the shape properties panel to change the way those objects are displayed. This is useful in interpreting data and making modelling decisions.
Changing how you view objects in the scene window does not change those objects in the project tree.
This topic is divided into:
- Removing Objects from the Scene
- The View List
- Colour Options
- Opacity
- Property Buttons
- Legends
- The Shape Properties Panel
Removing Objects from the Scene
All objects in the shape list have a button (![]() ) that will remove the object from the scene. Most objects also have a visibility button (
) that will remove the object from the scene. Most objects also have a visibility button (![]() ) that can temporarily hide that object in the scene. It is often easier to make an object temporarily invisible than to remove it from the list. Some objects have an edit button (
) that can temporarily hide that object in the scene. It is often easier to make an object temporarily invisible than to remove it from the list. Some objects have an edit button (![]() ) that you can click to begin editing the object.
) that you can click to begin editing the object.
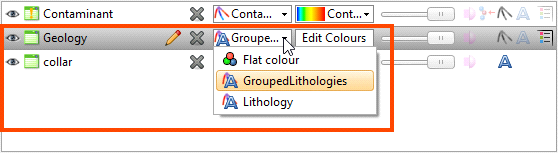
The View List
The view list is available for objects that can be displayed in different ways. For example, a lithology data table may contain several columns and the column displayed can be selected from the view list:
Geological and numeric model evaluations are also selected from the view list. See Evaluations.
Colour Options
The colour options for an object depend on the type of object. Three different colour display options are shown below:
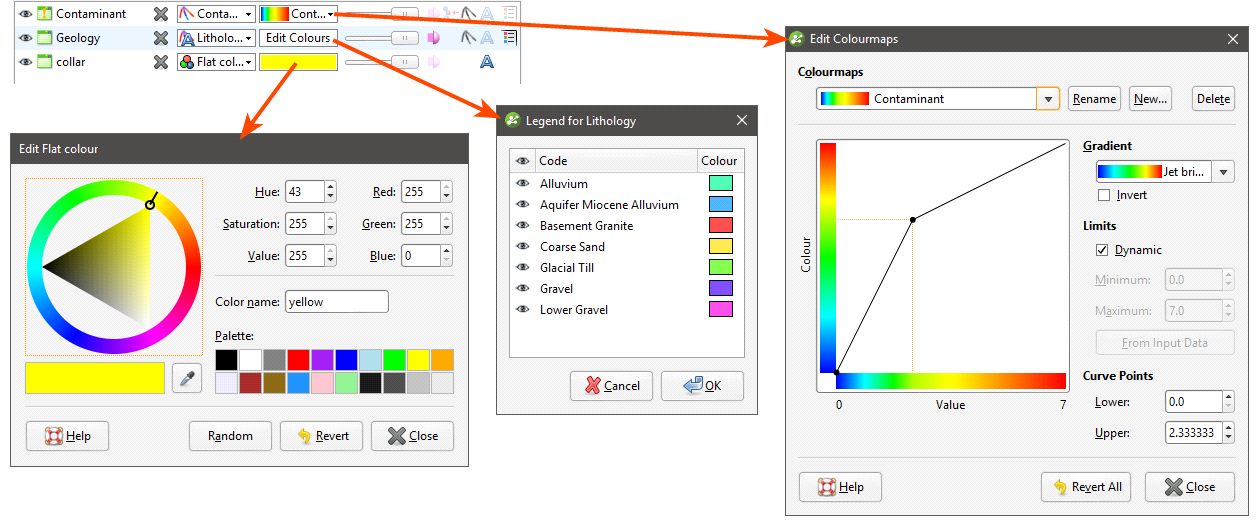
- The Contaminant table uses a continuous colourmap to display the numeric data. See Colourmaps and Colour Gradients for more information.
- The collar table is displayed using a single colour. Click the colour chip to change the colour. See Display Colours.
- The Geology table is displayed according to a colourmap of the categories in the table. These colours can be changed by clicking on the Edit Colours button, then clicking on each colour chip in the Legend window.
If your organisation uses standard colour coding for category and numeric data, you can import colourmaps for these data types. See Colourmap Import and Colour Gradients in Colourmaps and Colour Gradients.
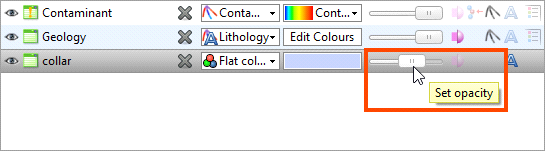
Opacity
The opacity slider controls the transparency of objects in the scene:
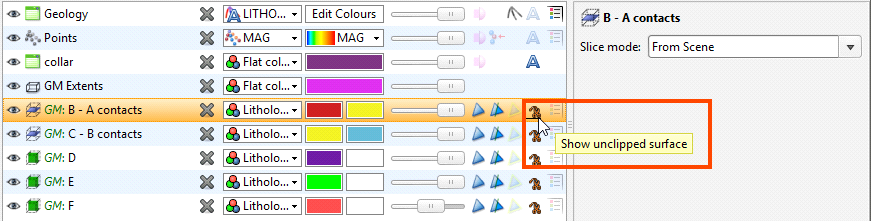
Property Buttons
Property buttons vary according to the type of object. For example, property buttons can show or hide the triangles on a mesh, render points as spheres or display a surface clipped to a model boundary. You can always find out what a button does by holding the cursor over the button:
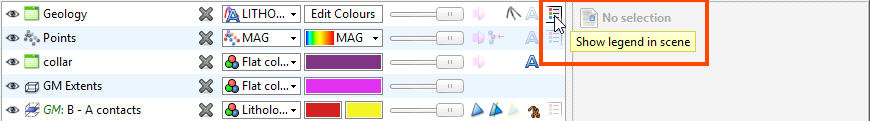
Legends
You can display a legend for many objects, including lithologies. To do this, click the legend button in the shape list:
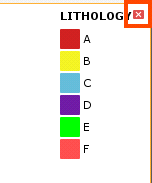
To remove the legend from the scene, either click the legend button again or click the red X in the scene window:
The Shape Properties Panel
The shape properties panel adjacent to the shape list provides more detailed control of the appearance of the selected object:
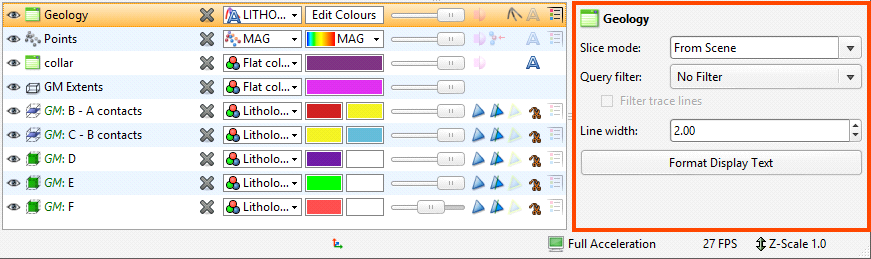
Slice Mode
The properties available depend on the type of object, but the Slice mode appears for all objects. See Displaying Sliced Data for more information.
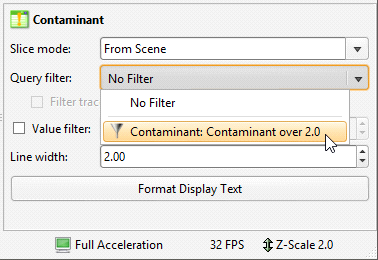
Filtering Data Using Queries
When a data table is selected in the shape list, you can use the controls in the shape properties panel to apply filters to the data in the scene. If query filters are available for the selected object, they will be listed in the Query filter list:
Filtering Data Using Values and Categories
You can also filter the range of values displayed by ticking the Value filter box, then setting the upper and lower limits of the range of data displayed:
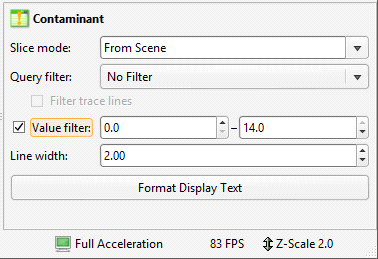
If the data includes date information, you can use the Value filter option to restrict the display to a range of dates.
Selecting Multiple Objects
You can select multiple objects in the shape list and change their display properties using the shape properties panel. To do this, hold down the Shift or Ctrl key while clicking each object you wish to change:
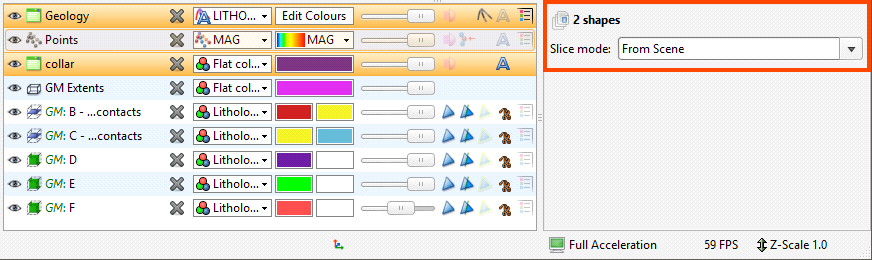
Only controls common to the selected objects are available.