Displaying Structural Data
Planar structural data is displayed as disks and lineations are displayed as cones. There are several ways to change how this data is displayed.
Planar Structural Data
In the scene below, planar structural data is displayed using the Flat colour option, with positive (red) and negative (blue) sides shown:
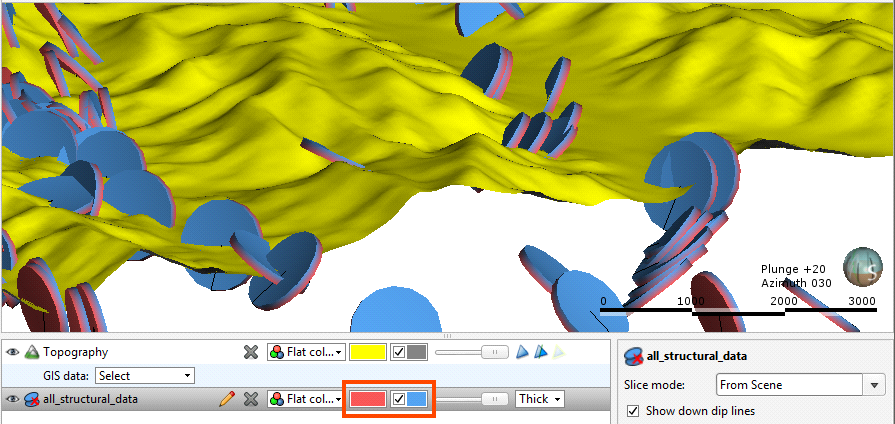
You can change the colours used to display the positive and negative sides using the controls in the shape list. You can also display the data points as Thick disks, Flat disks or as Outlined flat disks. You can change the Disk radius and the Disk size using the controls in the shape properties panel.
Another way of displaying planar structural data is to display the categories as different colours:
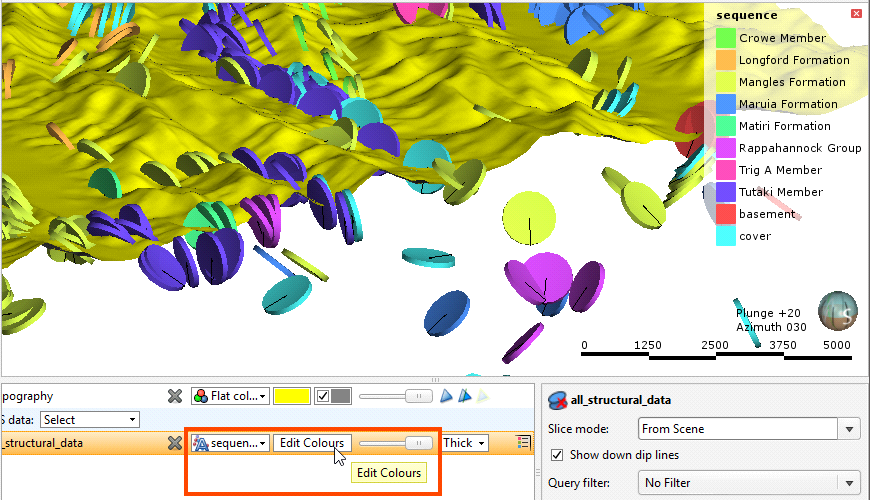
You can change the colours used to display the different categories by clicking on Edit Colours in the shape list. In the window that appears, click on the colour chip for each category and change it as described in Display Colours.
To set multiple categories to a single colour, use the Shift or Ctrl keys to select the colour chips you wish to change, then click on one of the colour chips. The colour changes you make will be made to all selected categories.
The categories displayed can also be filtered by other columns in the data table, as described in Filtering Data Using Values and Categories.
Lineations
In the scene below, lineations are displayed using the Flat colour option in green:
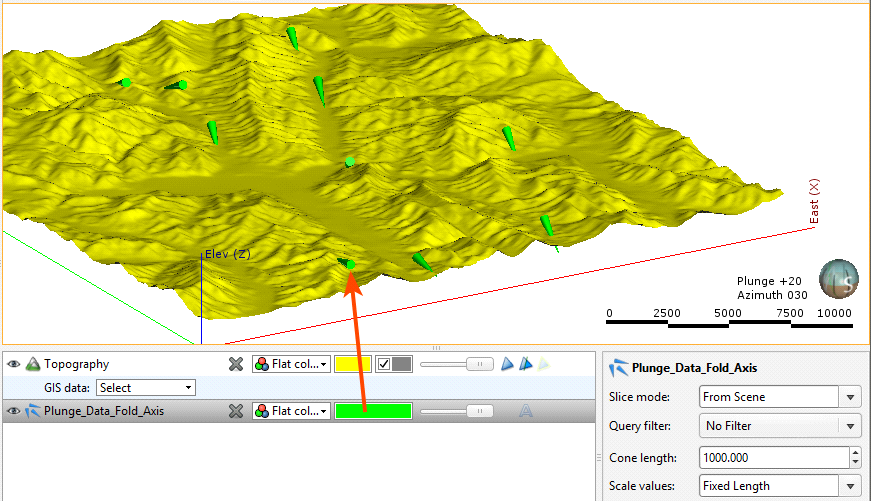
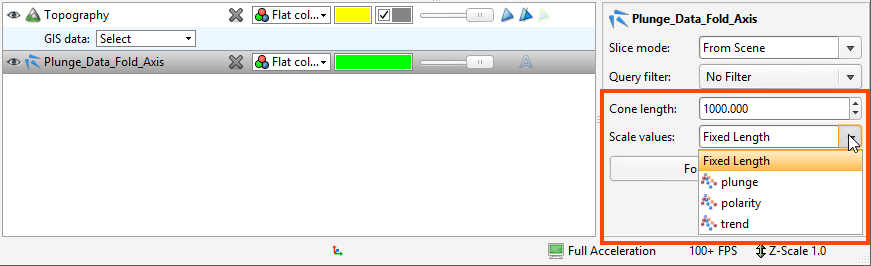
Click the colour chip to change the colour used to display the cones in the shape list or select one of the table’s columns:
The length of the cones displayed in the scene is set in the properties panel. This can be a Fixed Length, defined by the Cone length setting, or it can be scaled using the values from one of the table’s columns:
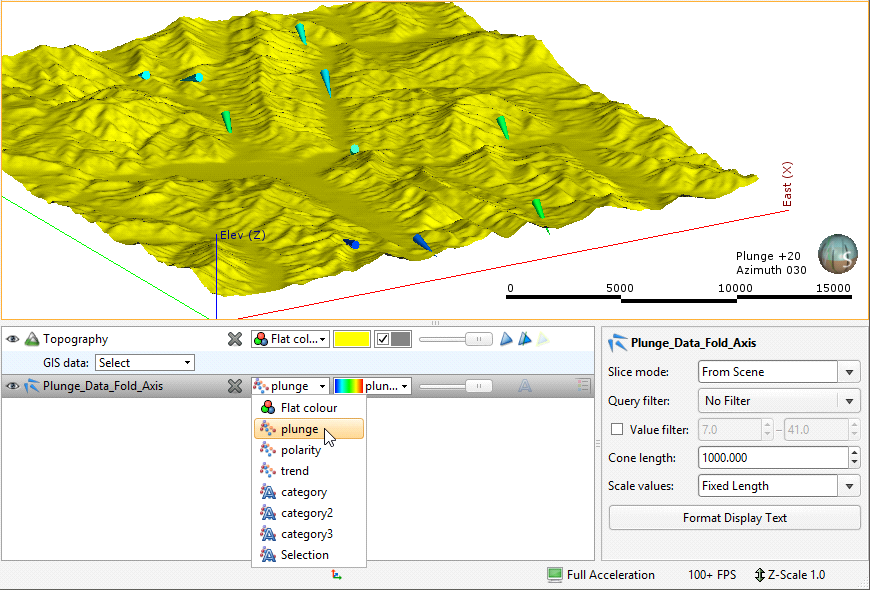
Another way of displaying lineations is to display the categories as different colours:
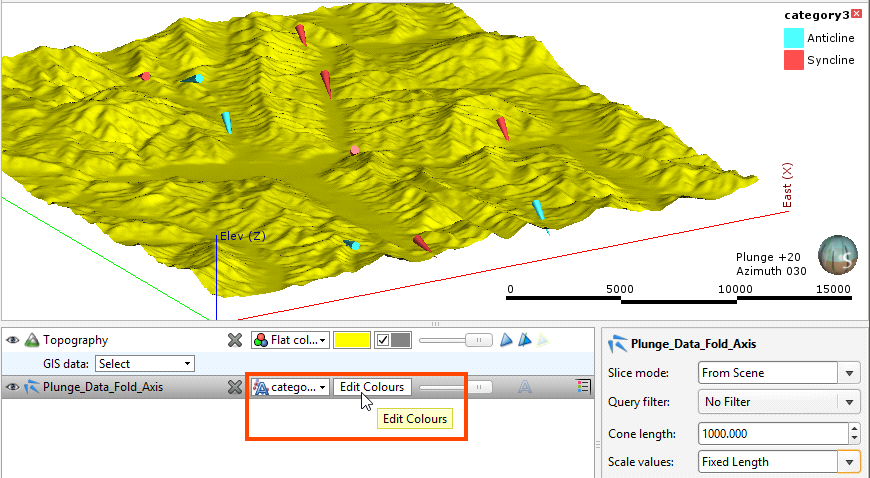
You can change the colours used to display the different categories by clicking on Edit Colours in the shape list. In the window that appears, click on the colour chip for each category and change it as described in Display Colours.
To set multiple categories to a single colour, use the Shift or Ctrl keys to select the colour chips you wish to change, then click on one of the colour chips. The colour changes you make will be made to all selected categories.
The categories displayed can also be filtered by other columns in the data table, as described in Filtering Data Using Values and Categories.