Domained Estimations
The features described in this topic are only available if you are licensed to use Leapfrog EDGE with Leapfrog Geo.
A domained estimation describes the boundary and values to be used for an estimation. Once a domained estimation is defined, you can then define variograms, sample geometries and estimators inside it.
This topic describes how to create and work with a domained estimation. It is divided into:
- Creating a Domained Estimation
- The Domained Estimation in the Project Tree
- Viewing Statistics
- Copying a Domained Estimation
Creating a Domained Estimation
To create a domained estimation, right-click on the Estimation folder and select New Domained Estimation. The New Domained Estimation window will be displayed:
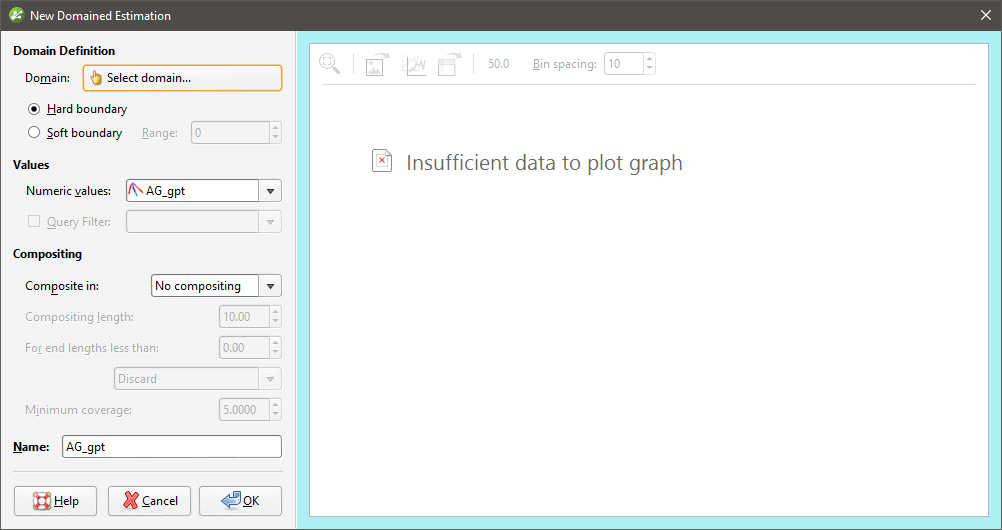
This window is divided into three parts:
- The domain definition
- The values used in the estimation and how they are composited
- The boundary validation chart
Tools in the window allow you to validate the domain and select whether the boundary should be a hard or soft boundary.
Defining the Domain
Click on the Select domain button to select from the suitable objects available in the project:
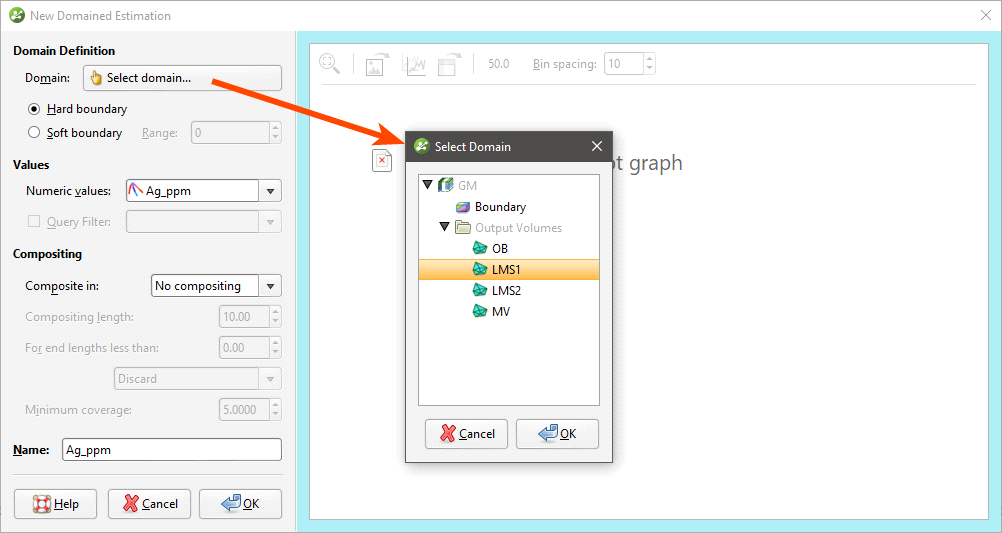
Any closed mesh can be selected to be used as the domain, including boundary objects and model volumes.
The selected domain can be used with a Hard boundary or Soft boundary. It is essential to the integrity of an estimate to select the type of boundary according to the real nature of the mineralisation. This is discussed in more detail in Boundary Validation below.
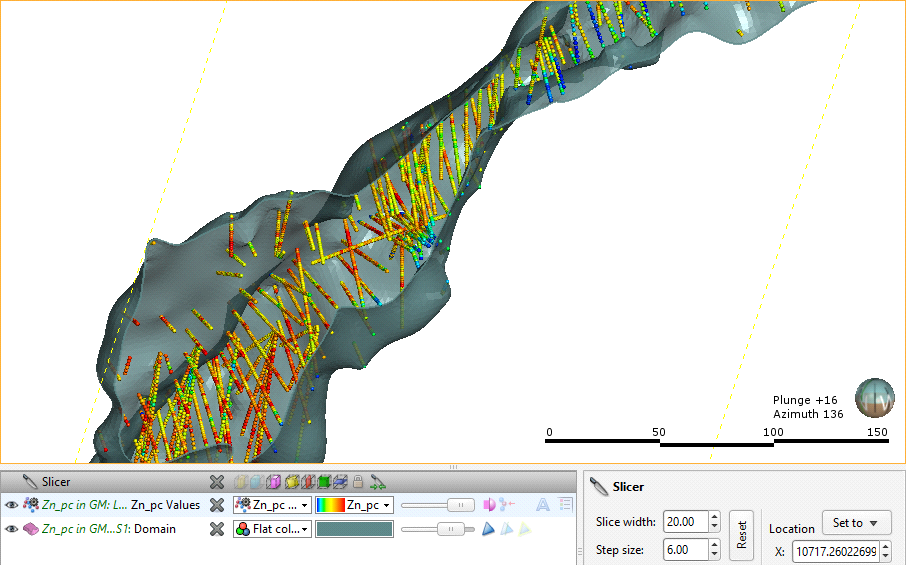
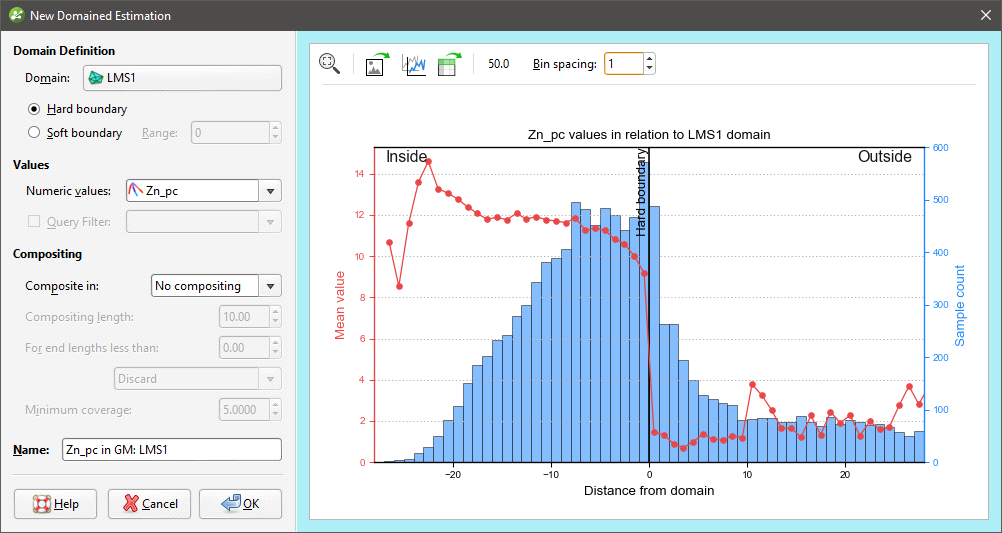
A Hard boundary uses only data within the domain’s boundary. This can be seen when you add a domained estimation to the scene; the values used do not extent beyond the boundary:
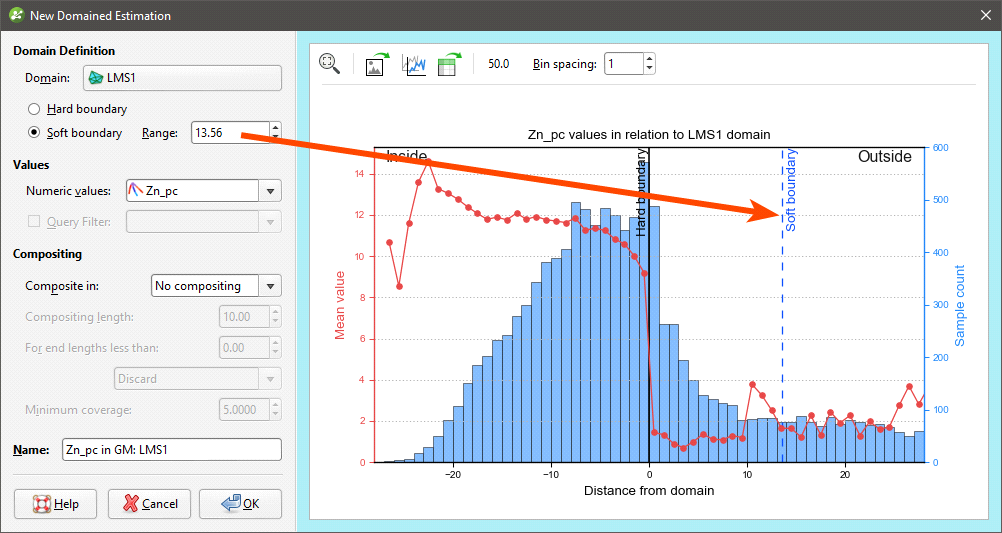
A Soft boundary will also make use of data beyond the domain boundary, up to the distance specified in the Range field. Here, the range is set to 10 and we can see that values outside the boundary are used:
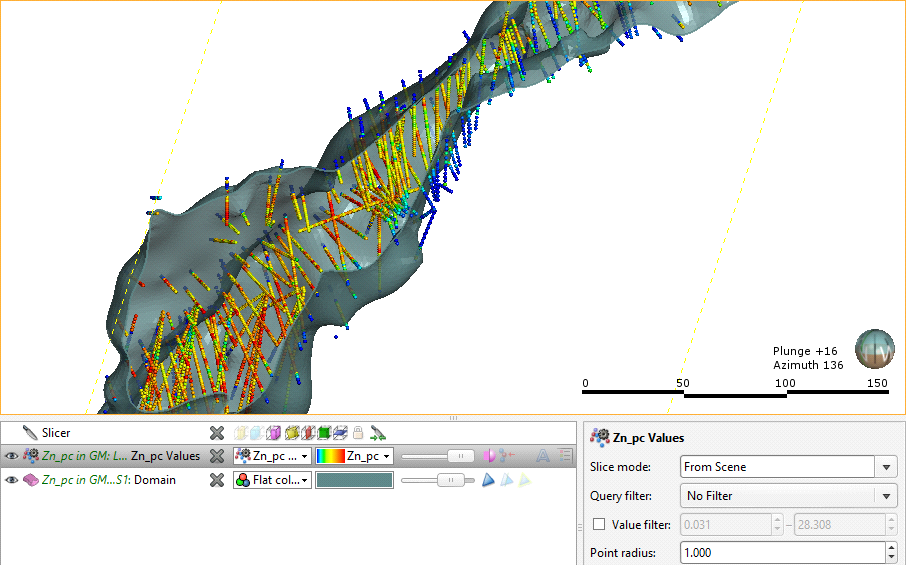
The Soft Boundary option provides the ability to create estimation objects strictly within the selected boundary, but to inform those estimation objects using relevant data immediately adjacent to but beyond the boundary.
- A fully soft boundary can be achieved by setting the Range to its maximum value.
- A semi-soft boundary can be achieved by constraining the Range to a lower value.
When a soft boundary is used, the values are taken within the specified range, measured perpendicular to the domain rather than along a drillhole. This prevents errors arising from drillholes at acute angles to the domain boundary.
Selecting Values
In the Values part of the New Domained Estimation window, select the values that will be used. If you have defined a query filter, you can use it to filter the values for the domained estimation by selecting it from the Query Filter list. Once the domained estimation has been created, you can remove the filter or select a different filter.
You can build a domained estimation from either:
- Numeric data contained in imported drillhole data, including composited data
- Points data imported into the Points folder
All suitable data in the project is available from the Numeric values list.
Setting Compositing Options
When numeric values from drillhole data are used to create the domained estimation, you can composite the data to simplify the geology for the purposes of estimation. If you do not have specific Compositing values in mind, you may wish to leave this option blank as it can be changed once the model has been created.
If the numeric values selected have already been composited, the Compositing settings will not be available in the New Domained Estimation window. Drillhole data can be composited directly by right-clicking on the Composites folder (under the Drillholes object) and selecting New Numeric Composite. See Numeric Composites.
There are three compositing options:
- No compositing
- Entire drillhole
- Within boundary
The compositing settings available depend on whether the boundary type is a hard or soft boundary. For soft boundaries, compositing is limited to the Entire drillhole option, whereas for hard boundaries, compositing can also be limited to the data within the domained estimation’s boundary.
See Numeric Composites for more information on the effects of the Compositing length, For end lengths less than and Minimum coverage settings.
When selecting compositing options, you may see a message: Warning: missing numeric data. This is not an error, but alerts you that some intervals are missing data.
Boundary Validation
Once you have selected the domain and the values you wish to use and set compositing options, the boundary analysis tools in the New Domained Estimation window help you to determine the best type of boundary to use:
If compositing is enabled for the domained estimation, the boundary validation information displayed is that for the uncomposited data.
A histogram of the sample count for each bin is included, so you can ignore things like an anomalous spike in mean grade associated with a very small sample count. Adjust the size of the horizontal axis bins using the Bin spacing setting.
The pale blue bars show the sample count for each bin, and the red dotted line segment plot shows the mean grade for the bin. The position of the Hard boundary is marked with a solid black vertical line. When a Soft boundary is selected, a vertical dotted blue line appears to show what values will be included, based on the Range setting. You can click on the soft boundary line and drag it to adjust the range:
When the mean grade line segment plot shows a sharp change at the boundary, a hard boundary may be appropriate. Click on points in the line segment plot to see statistics relating to the selected point.
To zoom the x-axis of the chart:
- Use the scroll wheel on your mouse to zoom in or out.
- Reset the zoom level by clicking the Reset view button (
 ).
).
The number to the left of the Bin spacing is the Clipping distance. This constrains the calculation of the graph to the specified distance from the domain, to improve application responsiveness. You can choose to set the distance to be right at the limit of the x-axis for maximum performance, or increase the distance to plot additional points to be visible when zooming out.
You can export the chart for use in external reports and other documents. There are three options:
- The Export data as CSV button (
 ) saves a CSV file containing the data so it can be reproduced and reformatted in a spreadsheet application.
 - The Export graph image button (
 )saves a PDF, SVG or PNG file of the chart.
 - The Copy graph image button (
 ) saves a copy of the chart image to the Windows clipboard for pasting into another application.
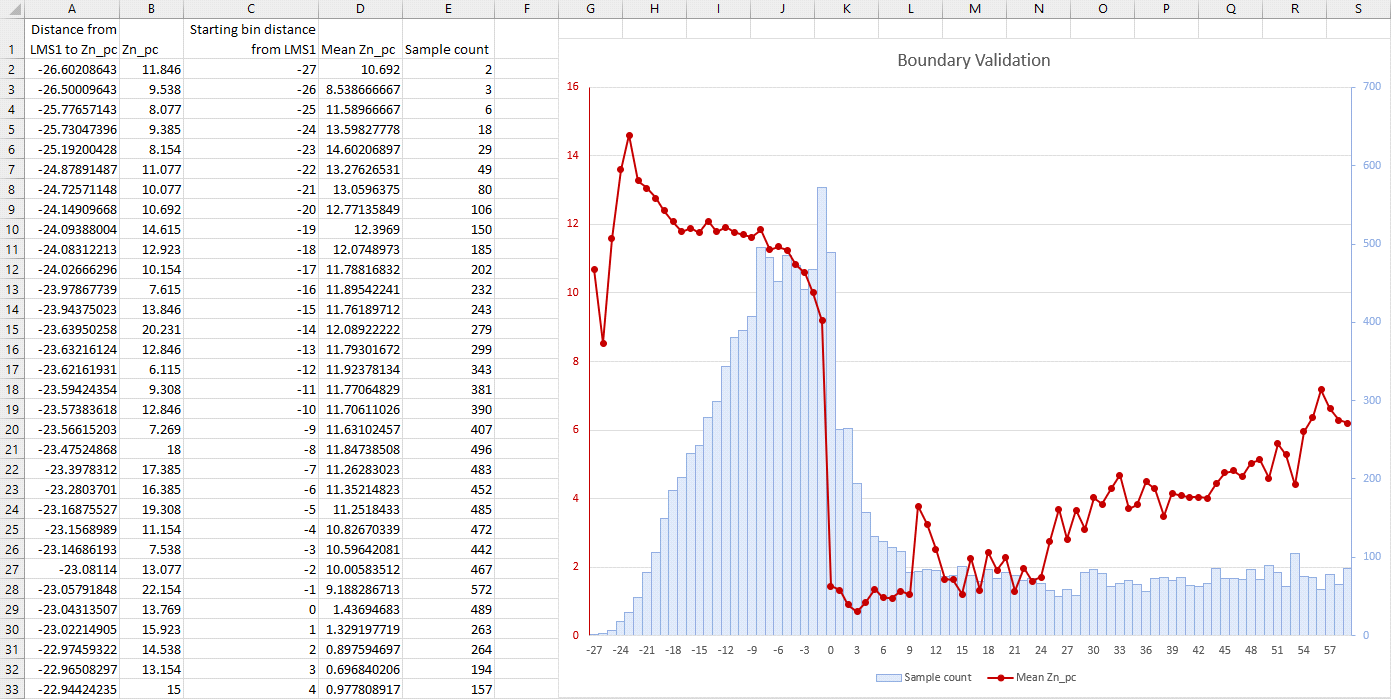
Note that when the Export data as CSV option is used, it is the last three columns (Starting bin edge, Mean grade and Sample count) that are required to reproduce the chart. The first two columns, Signed distance to boundary and Numeric value, contain all the data points required to create a new chart with different bin spacing:
The Domained Estimation in the Project Tree
Once you have entered a name for the domained estimation, click OK. The domained estimation will be added to the project tree under the Estimation folder. You can edit its settings by double-clicking on it.
A domained estimation contains five objects:
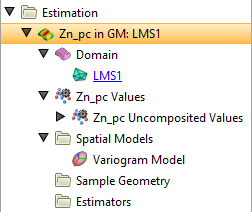
- The Domain defines the limits of the estimation object. To select another domain, double click on the domained estimation and click the Domain button to select a new mesh.
- The points data values object contains all the data used in generating the estimation object. These comprise midpoints for all the value intervals. You can easily change the values used by selecting a different Numeric values column or by applying an optional query filter.
- The Spatial Models folder contains variogram models. There will be a default variogram model created when the domained estimation is created. Edit the existing variogram model by double-clicking on it or create a new one by right-clicking on the Spatial Models folder and selecting New Variogram Model. See Variogram Models for more information.
The default variogram model is not auto-fitted and should not be assumed to be the initial hypothesis for the workflow. While some reasonable defaults have been selected for the default variogram model, the geologist’s personal hypothesis should be the starting point for the estimation workflow.
- The Sample Geometry folder contains data density functions that can be used when declustering data. See Sample Geometries for more information.
- The Estimators folder contains estimators that can be evaluated onto block models. Estimators are similar to Leapfrog RBF interpolants (see Numeric Models), with the exception that estimators select and refer to an independently constructed variogram model.
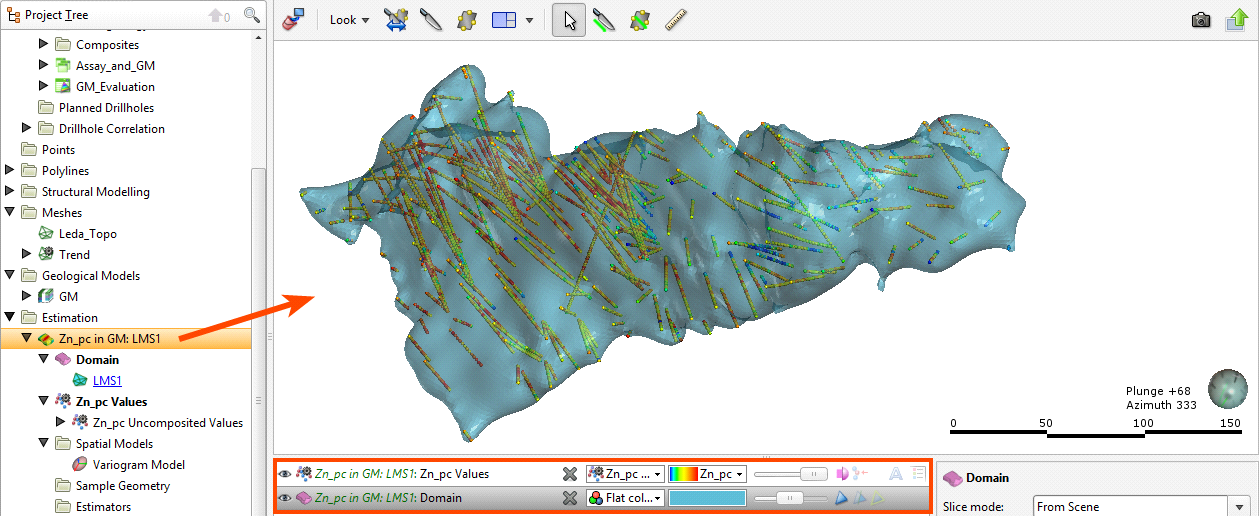
You can view a domained estimation by dragging it into the scene; this adds the Domain and Values objects to the scene.
Viewing Statistics
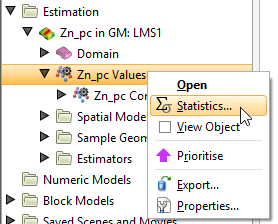
You can view statistics for the values used in the domained estimation by right-clicking on the numeric data object and selecting Statistics:
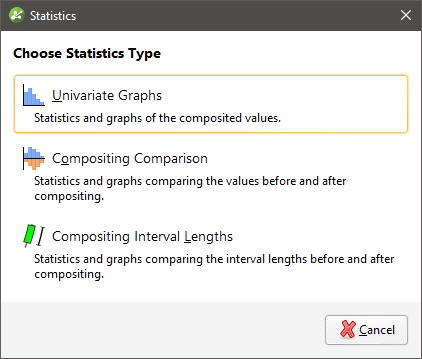
A Statistics window lets you Choose Statistics Type from three options: Univariate Graphs, Compositing Comparison and Compositing Interval Lengths:
For more details on viewing these statistics, see Analysing Data.
Only Univariate Graphs will be available if:
- The selected values have not been composited when the domained estimation was created.
- The selected values are drillhole data that was composited directly; that is, the data column used is in a table in the Composites folder.
To view side-by-side composited and raw data for a data column in the Composites folder, right-click on the data column in the Composites folder and select Statistics.
Copying a Domained Estimation
Reusing the same variograms, spatial models and estimators can be achieved by copying a domained estimation and then changing its boundary and values. Organising estimations in this way allows you to define a set of spatial functions and estimators that can then be reused with different values. For example, if you have multiple domains to estimate, you can define one, copy it, then change that copy’s domain to one of the additional domains. Or you could experiment with different hypotheses: once you have defined a set of spatial functions and estimators, you can make a copy of the domained estimation and change that copy’s values and boundary.
Got a question? Visit the My Leapfrog forums at https://forum.leapfrog3d.com/c/open-forum or technical support at http://www.leapfrog3d.com/contact/support