Working in Logging Sheets
This topic describes how to log data using the MX Deposit mobile app.
From the drill hole/logging screen, tap on the drill hole that has been assigned to you. Its logging sheets will open, showing the header and all the tables assigned to you.
If you are familiar with Excel, you will recognize many of the functions within these logging sheets or tables. These are:
- Adding and Deleting Rows
- Data Entry Modes
- Entering Data Using Fill Down Action
- Splitting Rows
- Merging Rows
- Strip Logs
Adding and Deleting Rows
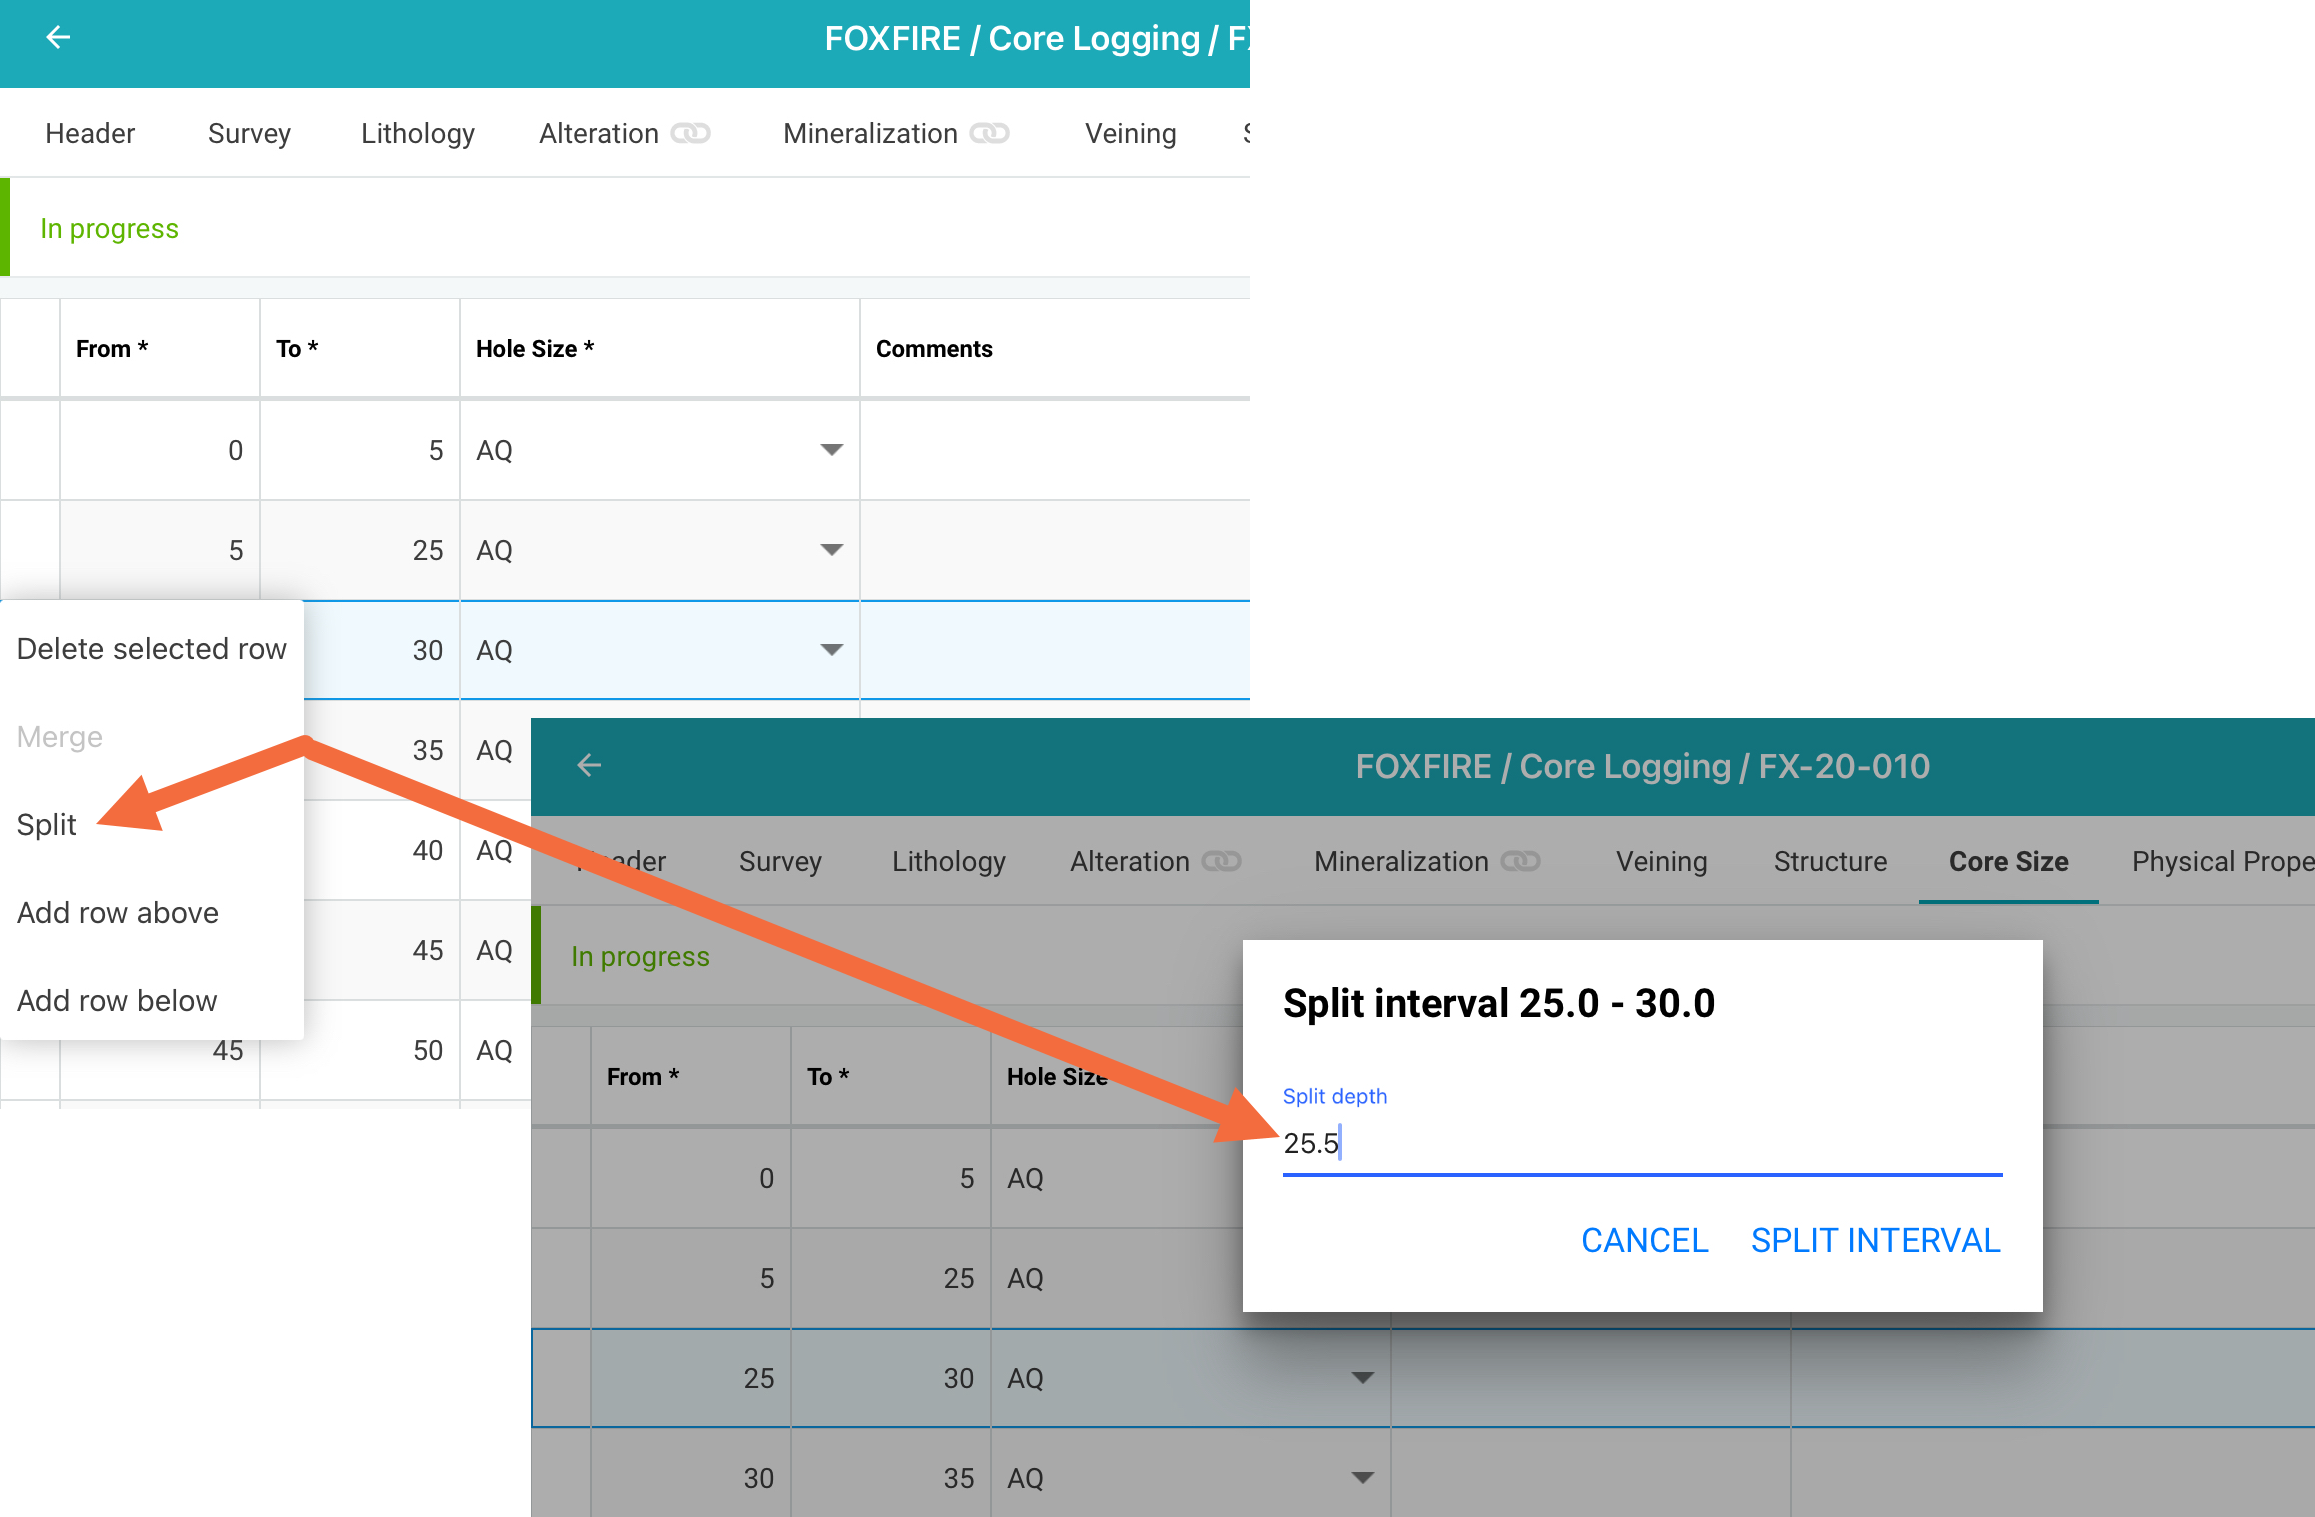
There is a blank “cell” at the start of each row. To add a row tap this leftmost cell for one of the rows in the table, then select the required option:
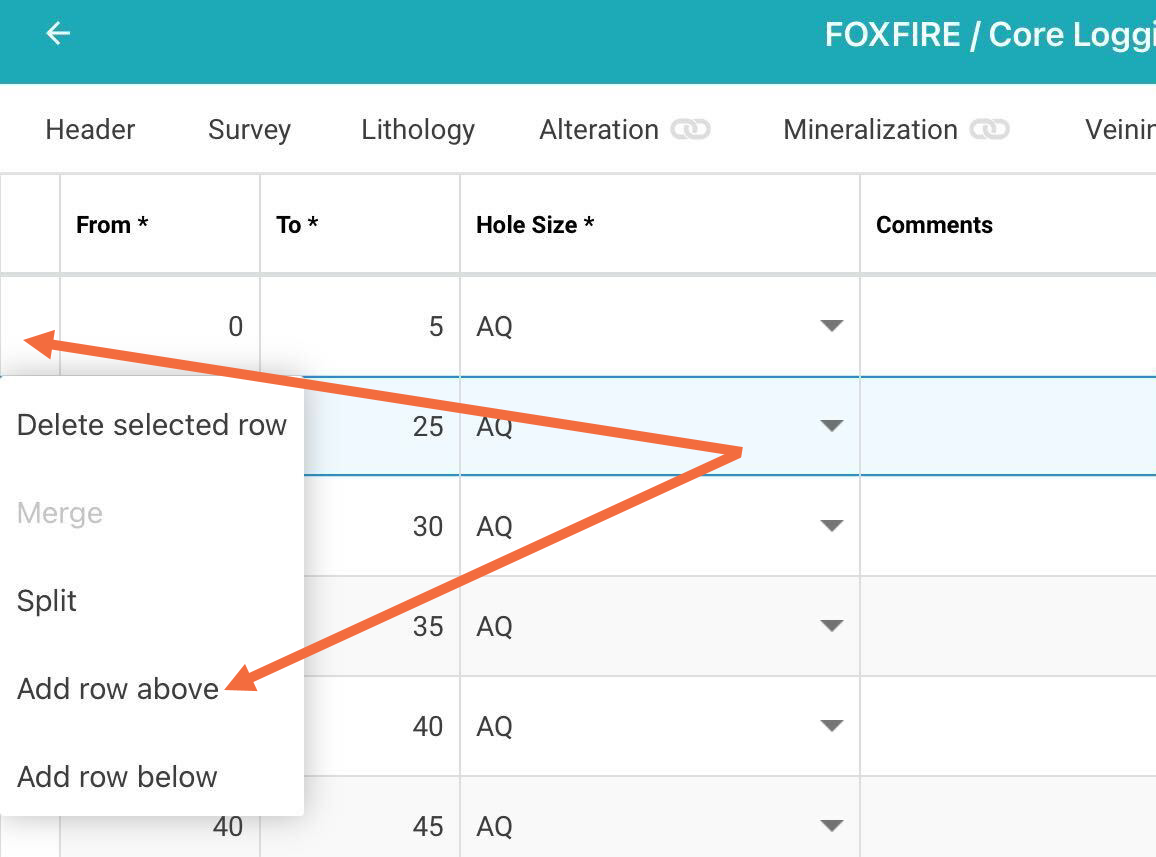
If you wish to delete a row, tap its leftmost cell and select the delete option.
Data Entry Modes
There are a number of ways to enter data, and which options are available to you can depend on how your admin has configured the table. Possibilities include:
- A picklist where you choose a value
- A data entry cell where you type in the information
- A file, where you take a photo or add a file from your device
Entering Data Using Fill Down Action
Where you have a large amount of the same data to be logged at different intervals, you can use the fill down function, incrementing values by an amount set by your admin. For example, you may have a row with From/To values of 35 and 40 and you want to add rows at 40/45, 45/50 and so on.
To do this:
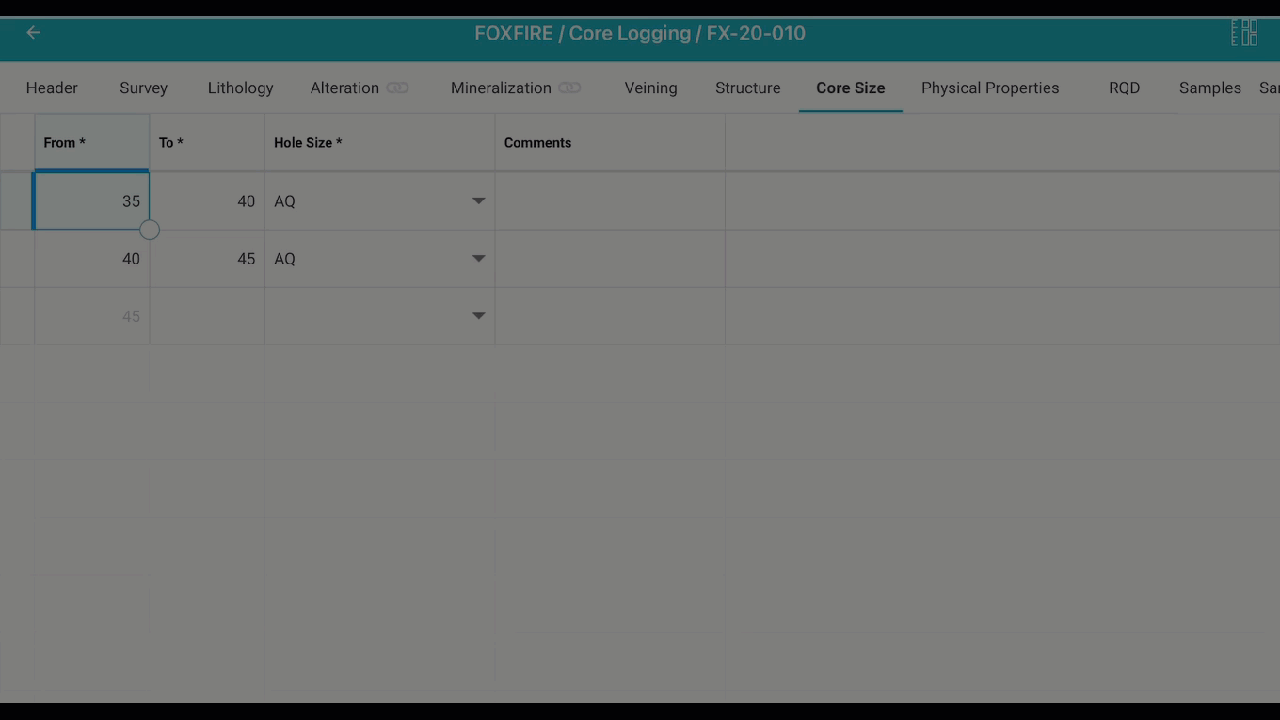
- Highlight the row or section of cells you want to use to fill down.
- Use the circle at the bottom right corner of the highlighted section and drag it down to cover the rows you want to fill.
The initial cells selected will be copied and filled down to the bottom of the selection, by the increment set by your admin.
If there is data in any of the cells below the selected initial row, existing data will be overwritten.
Splitting Rows
Within an interval you may want to capture more information at smaller intervals. To do this, tap on the leftmost column then select Split, then enter the Split interval:
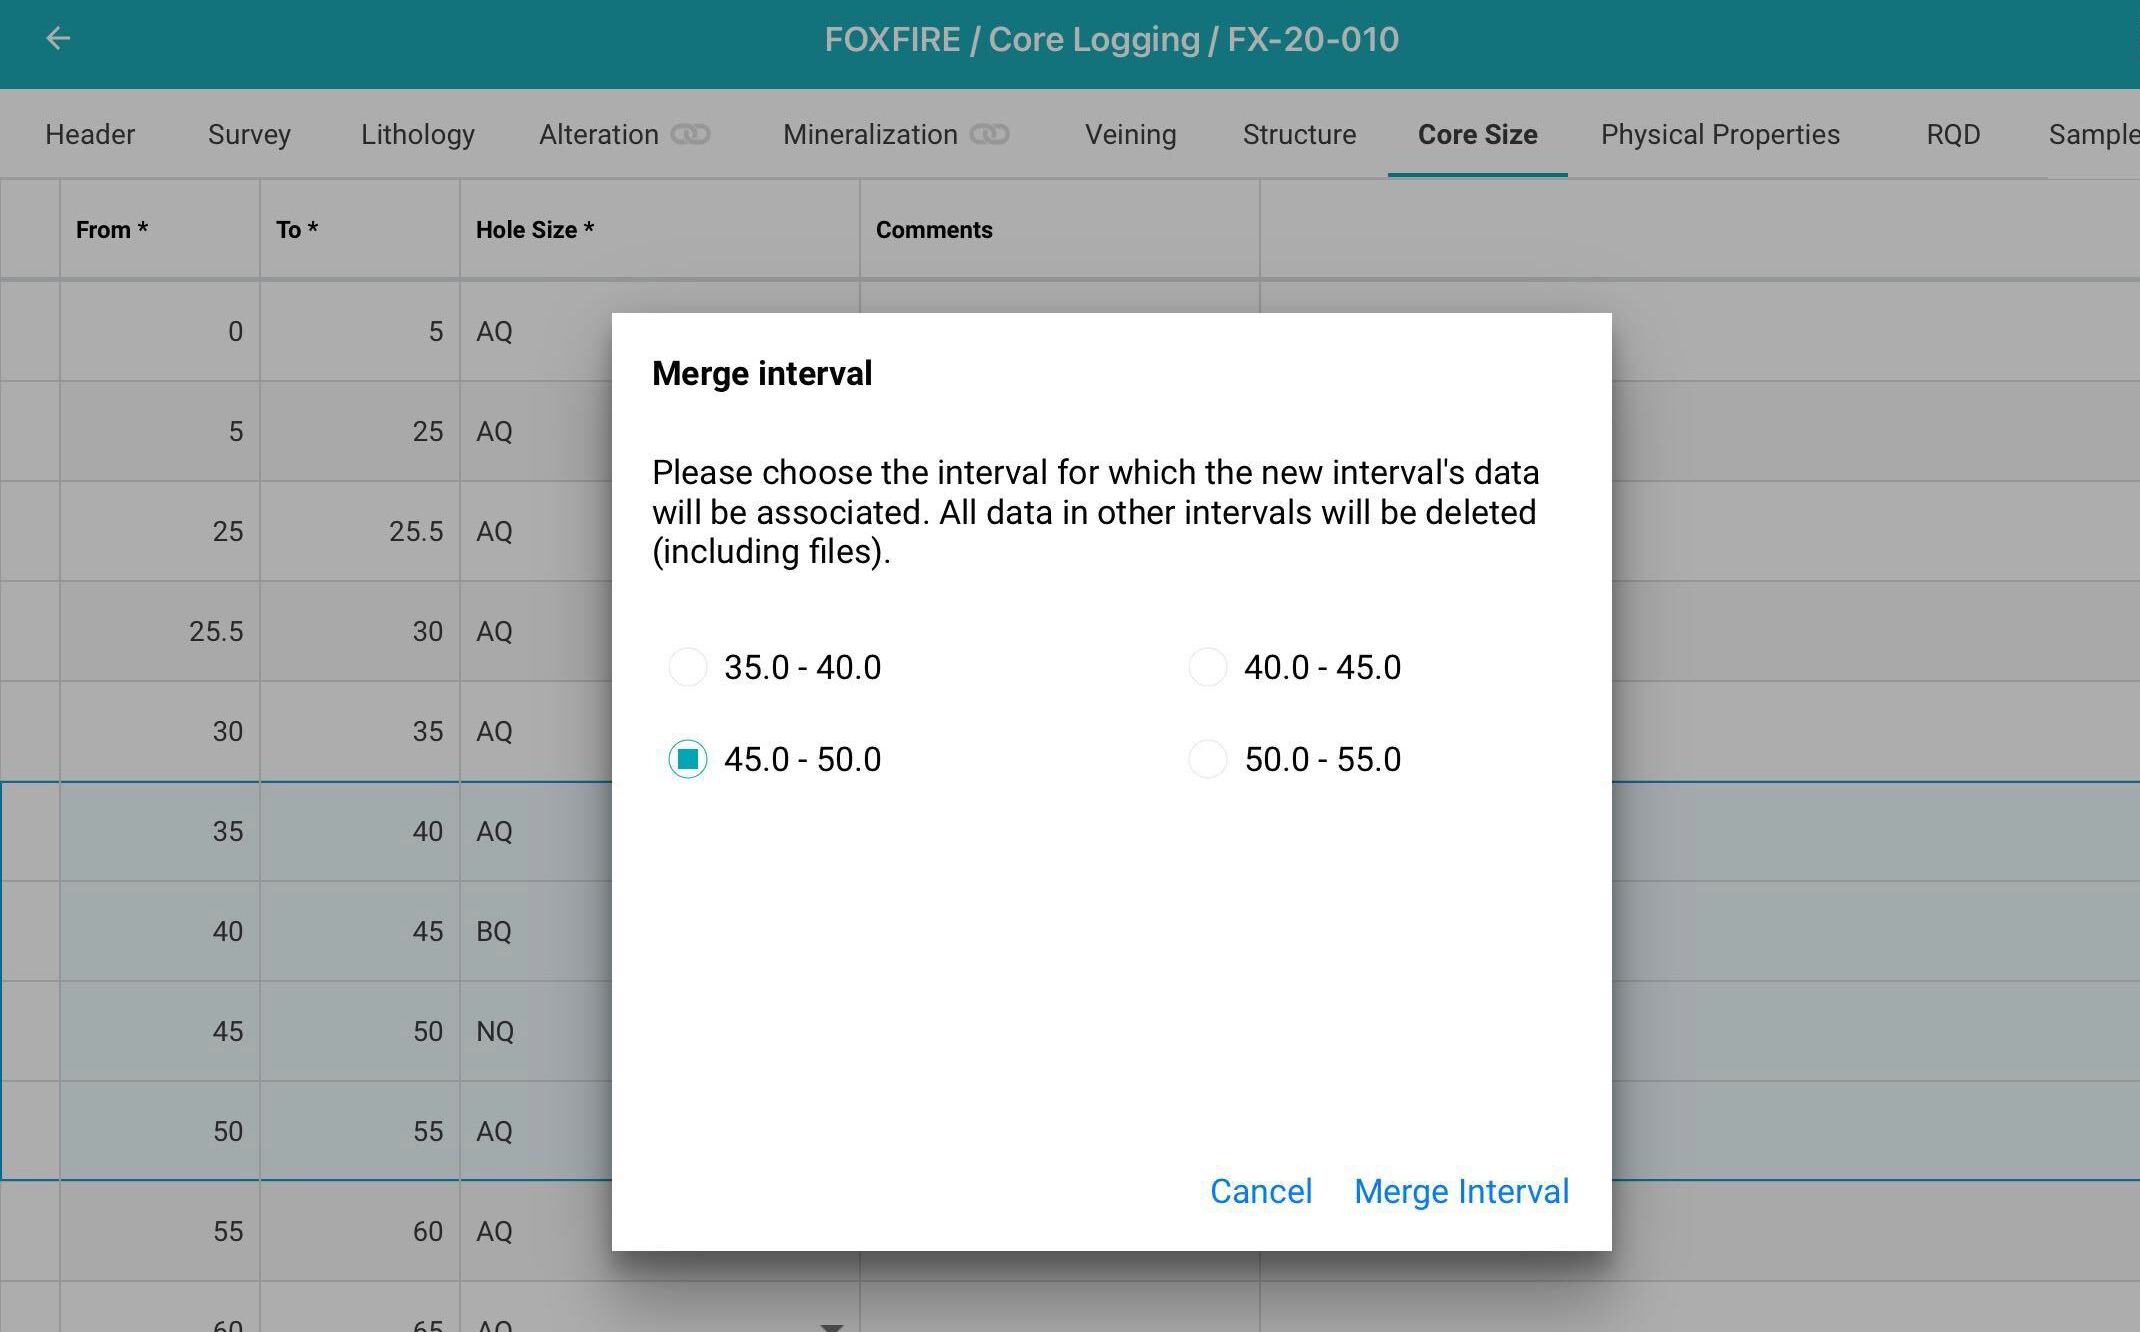
Merging Rows
To merge rows, tap on the leftmost column and highlight the rows you want to merge by holding and dragging down. Next, tap Merge.
If the values in all the rows are the same, the cells will be merged using the first and last intervals of the selection. If the values are different you will be prompted to choose the interval to use, which is the case here:
Strip Logs
With MX Deposit you can visualise drilling data as a strip log. Strip logs can maximise the usefulness of available information by providing a visual representation of data as well as showing where there are gaps in the data.
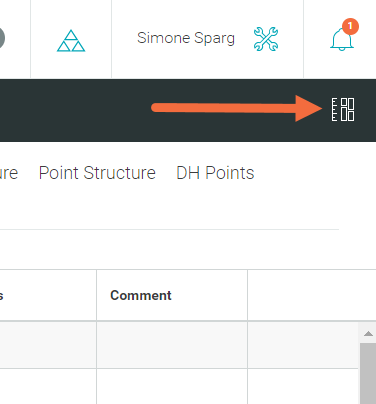
Open a drill hole, then tap the strip log button.
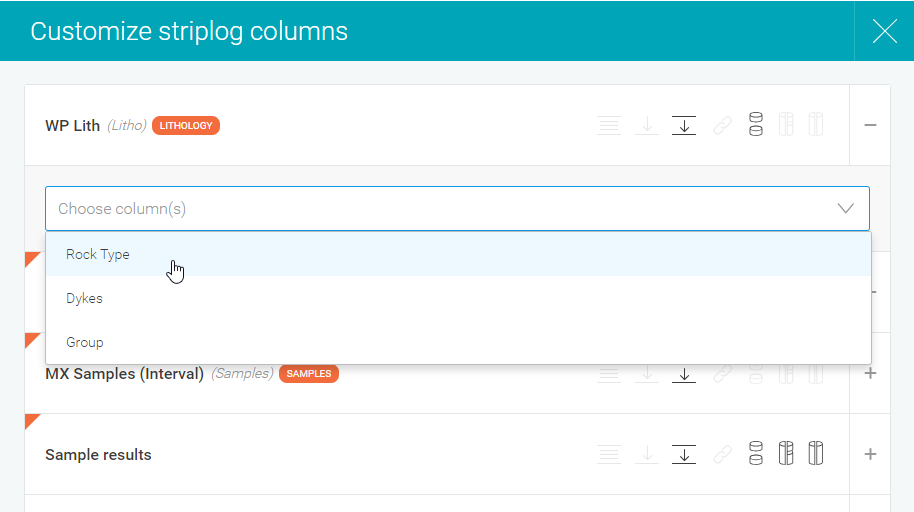
Tap the edit button to start building your strip log.
A list of all available tables will appear. Choose the columns from each table that you would like to visualise in a strip log.
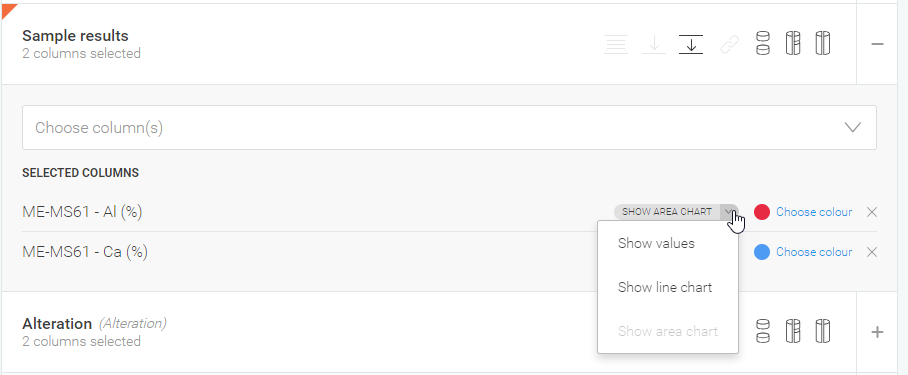
Once you have selected your columns, you can also choose how you want the values to display. Depending on the value, you can choose to display as a colour, value, line chart or area chart.
Once the strip log is built, it will be available to anyone who has access to this drill hole.
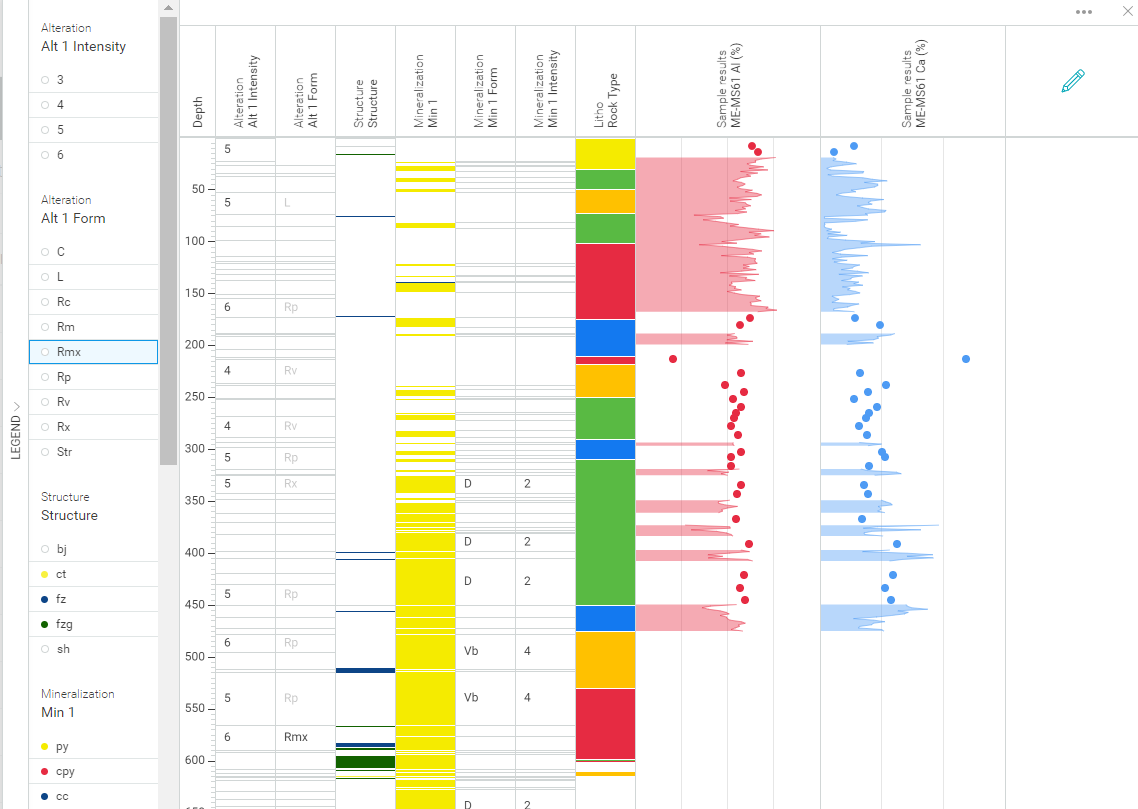
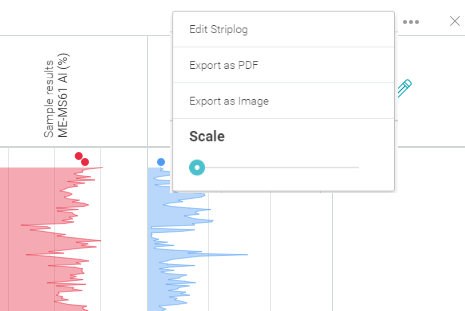
The overflow button provides options for exporting the strip log and changing its scale.