|
Xmin, Ymin, Xmax, Ymax
|
The limits of the area to be gridded.
Xmin, Ymin
The ground coordinates of the first grid point at the bottom left corner of the rectangular grid area. (Default, the minimum limits of the input data file are used).
Xmax, Ymax
The ground coordinates of the last grid point at the top right corner of the rectangular grid area. (Default, the maximum limits of the input data file are used).
Script Parameter: BIGRID.XYRANGE
|
|
Maximum line separation
|
Maximum line separation in data units.
Maximum Line Separation is the maximum separation distance allowed between lines. Areas enclosed by lines that are farther apart than this distance are represented by dummy values in the output grid. By default, the maximum separation is set to 1.5 times the average line separation. If the line to line separation maximum is too narrow, the output grid will consist of data strips that frame each survey lines, with blank grid areas in between. The width of the data strips will depend on the number of cells that extend beyond the edges of the data in line 2 of the control file.
Script Parameter: BIGRID.SMX
|
|
Maximum point separation
|
Maximum point separation in data units.
The Maximum Point Separation is the maximum separation distance allowed between stations on a line. Gaps in lines wider than the station to station maximum are not interpolated. The default is to use the maximum line to line separation value.
If the entered value is smaller than the output cell size, then internally it is increased to be equal to the output cell size. 24-Feb-06
Script Parameter: BIGRID.GAPLIM
|
|
Cells to extend beyond data
|
The number of cells to extend beyond the edges of the data. By default, the number of cells is set to 1 when gridding data, which ensures that the grid will always extend at least a fraction of a cell past the ends of valid data. When re-gridding grids, the number of cells is set to 0 by default to prevent growth of the grid.
Setting the number of cells beyond the edges of the data to 2 or 3 and the maximum separation permitted between lines to the grid cell size will produce a strip grid. A strip grid will only have valid data in strips that frame the survey lines. This is an effective presentation when lines are too far apart to be gridded properly.
Script Parameter: BIGRID.NEX
|
|
Spline down-line
|
Select the down-line spline method, "Cubic", "Akima", "Linear" and "Nearest neighbor" (default Akima).
For data that is sampled at a high density relative to the grid cell size, such as is often the case for airborne data, linear interpolation is usually sufficient for the down-line spline and will produce some saving in computation time.
Script Parameter: BIGRID.ISP1
|
|
Spline across-line
|
Select the across-line spline method, "Cubic", "Akima", "Linear" and "Nearest neighbor" (default Akima).
In cases where the data contains rapid changes in gradient, the minimum curvature (cubic) spline may produce undesirable highs or lows in the final grid. This most commonly occurs across lines with poor line-to-line correlation of the data. The Akima spline method does not suffer as much from this problem, although it does tend to produce sharper corners around actual data points and the resulting grid tends to be less smooth.
Script Parameter: BIGRID.ISP2
|
|
Low-pass filter wavelength
|
Specify the Low-pass filter wavelength.
To apply a low-pass filter, specify only the short wavelength cut-off. The low-pass cut-off is specified in the same distance units as the data file.
Script Parameter: BIGRID.WS
|
|
High-pass filter wavelength
|
Specify the High-pass filter wavelength.
To apply a high-pass filter, specify only the long wavelength cut-off. The high-pass cut-off is specified in the same distance units as the data file.
Script Parameter: BIGRID.WL
|
|
Non-linear filter tolerance
|
Specify the tolerance in "Z" units (eg. gammas) for the non-linear filter.
Non-linear filtering uses logic to determine if a given data point is part of the short wavelength information to be removed or not. The decision is based first on wavelength, then on an amplitude tolerance. If, based on wavelength, a data point is considered part of the short wavelength information. It’s amplitude, relative to a local background is compared to the non-linear filter tolerance. If it exceeds this tolerance it is removed from processing and replaced by a local background value. The non-linear filter is excellent for removing data spikes. The cut-off wavelength used for the non-linear filter is the same as the wavelength specified for the low-pass filter (see above section).
If the non-linear filter tolerance is blank, a non-linear filter is not applied.
Script Parameter: BIGRID.TOLN
|
|
Pre-filter sample increment
|
Specify pre-filter sample increment.
If the distance between each data point on a line differs by more than the default tolerance (2 %), the line is first re-sampled at an increment using the down-line spline. The data is then filtered and splined again to the grid cell size. By default, the resample increment is set to the smaller of the grid cell size or the smallest data increment on the first survey line.
Script Parameter: BIGRID.FDX
|
|
Data pre-sort option
|
Select pre-sort data options, "none", "pre-sort data", "remove backtracks" (Default "none").
Presorting of the data will sort each line so that all data points are consecutive in the gridding direction. Caution should be exercised when pre-sorting because data entry errors may result in the data being sorted out of order.
The remove back-track data option will cause data in the line that appears to backtrack to be removed. Use this option when processing airborne geophysical data.
Script Parameters: BIGRID.PRESORT
|
|
Log option
|
You can either grid the original data or its logarithmic (base 10) representation. Gridding the log of the data can be a very effective way to reduce distortion due to highly skewed data such as geochemical data.
The options are:
- linear: grid the data as it is.
- log, save as linear: grid the data in logarithmic space and clip all values less than ‘Log minimum’ to the ‘Log minimum’ value, then convert the data back to linear space before saving it to the grid file.
- log-linear, save as linear: grid the data above the positive ‘Log minimum’ and below the negative ‘Log minimum’ in logarithmic space (flip the sign of the data originally in the negative range to take the logarithm then inherit back the sign of the original data; grid the conditioned data). After gridding, all cell values outside the ± ‘Log minimum’ range are converted back to linear space and scaled to maintain continuity at the boundary. Data within the ± ‘Log minimum’ range remains intact and is gridded in a linear sense.
Finally, the linear representation of the data (in both ranges) is saved to the grid file.
- log, save as log: same as ‘log, save as linear’ except that the grid values are kept in log space: the gridded values are saved to the grid file in their logarithmic representation.
- log-linear, save as log: same as ‘log-linear, save as linear’ except that the grid values are not converted back from log space. The output grid is in logarithmic space with the large amplitude anomalies being somewhat moderated.
Script Parameters: BIGRID.LOGOPT
linear: 0
log, save as linear: -1
log-linear, save as linear: -2
log, save as log: 1
log-linear, save as log: 2
|
|
Log minimum
|
If gridding in log space (see the Log options above), this parameter specifies the minimum value. The default is 1.
Script Parameters: BIGRID.LOGMIN
|
|
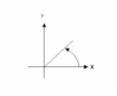
Trend angle (deg. ccw from +X)
|
Trend angle degree ccw from +X.
Script Parameters: BIGRID.TRA
|
|
Force grid direction
|
Select the grid direction "default", "For vertical lines (KX = 1)", "for horizontal lines (KX = -1).
The output grid direction parameter (represented by KX) determines whether the output grid lines will be parallel to the output grid X-axis (KX = 1) or the Y-axis (KX = -1). The variable KX should be chosen such that: the first interpolation is close to the survey line direction or, the second interpolation, which defines the direction of the output grid lines, is across the survey lines.
Note: If the survey lines run in the Y direction (vertical), KX should be 1; if the survey lines run in the X direction (horizontal), KX should be -1.
By default, BIGRID will choose KX so that the second interpolation direction is closest to perpendicular to the average line direction (i.e. the average of all lines) unless a trend angle is specified, in which case KX will be 1.
For more information see the Application notes below.
|
|
Do you have gradient data?
|
Specify "Yes" if you have horizontal gradient data that you would like to use in the gridding process.
- When data along the survey line is adequately sampled, splining along the survey direction honours the observed data. However, splining across the survey lines has more freedom to deviated from the true ground response. Supplying this gradient restricts this freedom in the direction normal to the primary survey direction, and improves on the conformity of the splined data with the actual ground response.
|
|
Apply
|
Begin gridding.
Note that if you have gradient data, you will first be presented with a dialog to specify the gradient gridding options.
|
If the line direction is very close to either north-south or east-west, BIGRID’s default settings are ideal. But if the survey lines are at other angles, you should override the default BIGRID settings to avoid odd streaking or other non-geological results. This approach will also enhance geological trends perpendicular to the line direction.
We recommend always following the procedure outlined below if your survey lines are not in the north-south or east-west orientations.
In the Gridding options dialog box specify the Trend angle (deg ccw from +X).
The "trend angle" is intended to enhance geological features in the direction specified. Since we ideally want to enhance features perpendicular to the survey line direction, we should specify this angle to be perpendicular to the line direction. Note that the angle to be specified is counter-clockwise relative to the positive X-axis (which normally points to the east).
For example, if your survey lines are oriented at N30E, you should specify a trend angle of either –30 degrees or 150 degrees. If your survey lines are oriented at N45W, you should specify a trend angle of 45 degrees.
The bigrid.log file is produced with each run and contains information about the bigrid process, including lines skipped due to backtracks or clipping.
