
Create Section(s) from Data
Use the Section Tools > Create Section(s) from Data menu option (geogxnet.dll(Geosoft.GX.CrookedSections.CrookedSection;Run)*), to produce geo-located section views on a map. Stacks of multiple sections of the same data channel can also be plotted on a single map.
Create Section(s) from Data dialog options
|
From |
Select the Database option if you want sections to be gridded from a database array channel and placed on map(s). Alternatively, if section grids already exist and Section grid(s) is selected, the gridding is skipped. Script Parameter: SECTION.DATA_SOURCE [0- database, 1-grid] |
|
Plot |
If Database has been selected above, you have the option to plot a section from the Current line, Selected lines or All lines. If the latter option is chosen, but not all database lines are selected, the plan view located in the legend will not display the deselected lines. If Section grid(s) has been selected above, you will be provided with an option to select the grid(s) to plot. If the grid(s) are not available in the drop-down list, you can select the browsebutton and navigate outside of your workspace to pick the grids to plot. Multiple grids can be selected. Script Parameter: SECTION.LINES [D – Displayed, S- Selected, A- All] or Script Parameter: SECTION.GRIDS [List of selected grids] |
|
Sections per map |
Specify the number of sections to plot per map. Sections can be plotted as one section per map, or multiple sections can be stacked on a single map. Script Parameter: SECTION.SECTIONS_IN_MAP [0- Individual, 1- Stacked] |
|
Data array |
Select a data array channel, using the drop-down list, from the array channels available in your current database. The Data array option is only available when plotting sections from a database. If the data array has a base property of a type other than depth or elevation, the property is entirely ignored. You must then supply a depth array defining the array vertical point locations. Script Parameter: SECTION.DATA |
|
Depth array |
Select a Depth array channel, using the drop-down list, from the array channels available in your current database. This list is populated with array channels of the same dimension as the selected data array. The channel specifies the vertical location of each of the data items to plot. The channel may contain values increasing up (elevations), or values increasing down (depths). You need to ensure that you properly pair the data array with a depth channel. Script Parameter: SECTION.DEPTH |
|
Negative depths |
Select the Negative depths box if the values in the depth array are in a right-handed coordinate system (positive Z up, such as elevation). Script Parameter: CDI.NEGATIVE_DEPTHS_DOWN (default: 0) |
|
Elevation |
Select the Elevation channel. You can use this channel to define topography or a reference elevation. If defined, the depth or relative elevation values are added to the elevation values here to give the true elevation ("Z") of each data value. Script Parameter: CDI.TOP_ELEVATION_CHAN |
|
Section map prefix |
Specify a prefix for the output map(s). If the input source is a database, map names are formed by combining this prefix, the selected data array name, and the line number, separated by an underscore. If grids are selected, map names are formed by combining this prefix and the grid name. Script Parameter: SECTION.PREFIX |
|
Specify the horizontal scale of all sections. The scale is calculated so that the length of the longest line is equal to the view width. The View width parameter can be found on the Map Layout tab when you expand the More button. Click the calculate If you make the scale smaller than the default setting scale, the default width of the map will not be wide enough. In this instance, the physical length of the section map will be adjusted to honour the user defined scale and the default indicated in the Map layout tab is overridden. Script Parameter: SECTION.SCALE |
|
|
Vertical exaggeration |
A vertical exaggeration of 1 generates a section map with an aspect ratio of 1. If you would like to stretch the vertical scale, click the calculate This parameter depends on the View height parameter located in the Map layout tab. If you change the vertical exaggeration, you will be effectively modifying the vertical height of the section. The physical space allocated to the section on the map remains the same, potentially resulting in white space above and below the section within the section plot window. Therefore, it is recommended that when you change the vertical exaggeration parameter, you blank out the view height as well, to force the recalculation of the section view window. Script Parameter: SECTION.VERTICAL EXAG |
|
Surrounds |
The surrounds can be generated with "Default" settings. If you do not desire surrounds on the section maps, select "None". To further customize the section surround, select "Custom" and the Draw Section Surround dialog will appear after you click the OK button. Script Parameter: SECTION.SURROUNDS [0 – None, 1 – Default (default), 2 – Custom] |
|
[More] |
Click the button to expand the section and display the following tabs: Extents, Display, Grid, Map Layout, and Top Profile. All the tabs have default settings; you can further customize the maps through the use of these additional parameters. |
Extents - view and modify the extents of the data to plot |
|
|
Start horizontal extent |
By default, the entire horizontal extent is plotted. Click the calculate Script Parameter: SECTION.START |
|
End horizontal extent |
By default, the entire horizontal extent is plotted. Click the calculate Script Parameter: SECTION.END |
|
Top elevation |
By default, the entire vertical extent is plotted. Click the calculate Script Parameter: SECTION.TOP_ELEVATION |
|
Bottom elevation |
By default, the entire vertical extent is plotted. Click the calculate Script Parameter: SECTION.BOTTOM_ELEVATION |
|
Alignment |
Select the alignment for your sections. Stacked sections can be aligned in different ways. Select the one that best suits your data. Choose one of the next three options if your stacked sections are NOT near parallel. Left justify: All sections regardless of their position are stacked left-aligned and are plotted with the increasing order of the line numbers upwards. This is the default setting, regardless of the orientation of the section traces. (See Application Notes, illustration of Left Justified). Centre: All sections regardless of their position are stacked centered and are plotted in the increasing order of the line numbers. Right justify: All sections regardless of their position are stacked right-aligned and are plotted with the increasing order of the line numbers upwards. Choose one of the next two options if your stacked sections are near parallel. Align on eastings: If your sections are near parallel and close to the EW direction, choose this option. Align on eastings lines up the X axes of all the section traces on the stacked map so that the median of the X range of all the stacks is placed horizontally in the middle of the map. Furthermore the order of the line numbers is ignored and the sections are stacked in the increasing Y coordinate of the section traces. The northern most section is plotted at the top of the stacked map, and the southern most section is plotted at the bottom of the stacked map (See Application Notes, illustration of Align on Eastings). Align on northings: If your sections are near parallel and close to the NS direction, choose this option. Align on northings lines up the Y axes of all the section traces on the stacked map so that the median of the Y range of all the stacks is placed horizontally in the middle of the map. Furthermore the order of the line numbers is ignored and the sections are stacked in the decreasing X coordinate of the section traces. The westernmost section is plotted at the top of the stacked map, and the easternmost section is plotted at the bottom of the stacked map. Script Parameter: SECTION.ALIGNMENT [ 0-left justified (default), 1- Centered, 2-Right justified, 3-Align on eastings, 4 - align on northings ]" |
Display - modify the colour display attributes |
|
|
Colour method |
Select the colour method as one of the following options: As last displayed, Default, Histogram equalization, Normal distribution, Linear or Logarithmic. Script Parameter: SECTION.METHOD_ChannelName " [0: Default, 1: Linear, 2: Normal distribution, 3: Histogram equalization, 5: Log-Linear] |
|
Colours |
Select the colour scheme for rendering the grid or pixel plot. If you mouse over the colour scheme entry, a tooltip will display the name of the colour table file. To modify the selection, click on the colour entry and then navigate through the scheme categories. Script Parameter: SECTION.ZONEFILE_ChannelName |
|
Brightness |
Set the brightness for rendering the grid or pixel plot of the channel displayed in this tab. The normal brightness is defined at 0. You can change the brightness from -100 (black) to 100 (white) using either the slider bar or by entering an exact value. Script Parameter: SECTION.BRIGHTNESS_ChannelName |
|
Reverse colour distribution |
The colour scheme can be used in reverse order. Check this box to reverse the order for the channel on display above. Script Parameter: SECTION.REVERSE_ChannelName [0-No | 1 - Yes] |
|
Pixel view |
For display purposes, by default, the grid is first interpolated to a smooth image at the screen resolution. If you prefer to honour the grid resolution, the image will appear pixelated and the colour will change at the actual grid interval rather than the screen resolution. Formerly, this functionality was found under the image filters as " No smoothing (GRD)". Check this box to forgo the smoothing. Script Parameter: SECTION.PIXEL_ChannelName [0-No | 1 - Yes] |
Grid - view or modify the gridding options; this tab is only visible when a database has been selected as a source |
|
|
Display method |
A number of methods are offered to display the colour section image. Script Parameter: SECTION.DISPLAY_METHOD [MINCURV_GRIDDING, INVERSE_DISTANCE_GRIDDING, NONE, PIXEL_PLOT, DIRECT_GRIDDING] |
|
Horizontal cell size
Vertical cell size |
Depending on the selected display method, it is possible to set:
Script Parameter: SECTION.CELLSIZE_X Script Parameter: SECTION.CELLSIZE_Z |
|
[Advanced Gridding Options] |
The button is enabled if one of the gridding methods is selected as the display method. Click on the button to set advanced options for the selected gridding method. |
Map Layout - modify the map view width, view height, margins, and space between sections |
|
|
View width View height |
Specify the width and height, in cm, of the section view. These values are initialized to the values contained in the selected page layout. If you do change the default exaggeration on the main dialog, you can get a view confined to the section only if you blank out the View height and force the recalculation of this parameter. Script Parameter: SECTION.WIDTH Script Parameter: SECTION.HEIGHT |
|
Top Margin Right Margin Bottom Margin Left Margin |
Specify the four margins, in cm, of the section view. These values are initialized to the values contained in the selected page layout. Script Parameter: SECTION.TOP_MARGIN_CM SECTION.BOTTOM_MARGIN_CM SECTION.LEFT_MARGIN_CM SECTION.RIGHT_MARGIN_CM |
|
Space between sections |
Specify the space between the sections, in centimeters. Script Parameter: SECTION.MARGIN_BETWEEN_SECTIONS_CM |
Top Profile - specify a top topography profile |
|
|
Topography |
Select the ground elevation channel, on the same axis as the elevation data. This can be, but does not have to be the same as the Elevation channel. Script Parameter: SECTION.TOPOGRAPHY |
|
Plot top of section |
Select to draw the trace of the topography along the top of the section(s). The Line thickness and Line colour options for the topography trace will be enabled below. Script Parameter: SECTION.TOP_ELEVATION |
|
Line thickness (mm) |
Specify the line thickness of the trace in millimeters. Script Parameter: SECTION.TOP_PROFILE_LINE_THICKNESS |
|
Line Colour |
Select the line colour of the trace by clicking the colour scheme, and the Colour tool will appear. Script Parameter: SECTION.TOP_PROFILE_LINE_COLOUR |
|
Plot location symbols |
Select to indicate the location of the readings along the top of the section(s). The Symbol size, Edge colour and Fill colour options for the symbols will be enabled below. Script Parameter: SECTION.PLOT_LOCATION_SYMBOLS |
|
Symbol size (mm) |
Specify the location symbol size in millimeters. Script Parameter: SECTION.LOCATION_SYMBOL_SIZE |
|
Edge colour |
Select the symbol edge colour by clicking the colour scheme, and the Colour tool will appear. Script Parameter: SECTION.LOCATION_SYMBOL_EDGE_COLOUR |
|
Fill colour |
Select the symbol fill colour by clicking the colour scheme, and the Colour tool will appear. Script Parameter: SECTION.LOCATION_SYMBOL_FILL_COLOUR |
 button to re calculate the scale, based on the currently defined view width and line length.
 Application Notes
*The GX tool will search in the "...\Geosoft\Desktop Applications \gx" folder. The GX.Net tools, however, are embedded in the geogxnet.dll located in the "...\Geosoft\Desktop Applications \bin" folder. If running this GX interactively, bypassing the menu, first change the folder to point to the "bin" folder, then supply the GX.Net tool in the specified format.
Extents - Alignment
The images below are in reference to the Alignment parameter on the Extents tab.
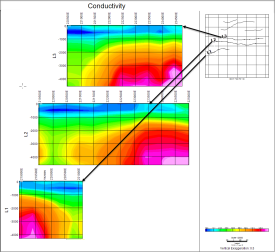
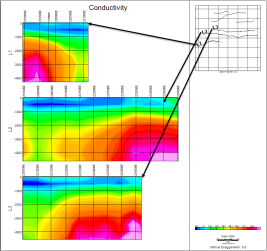
Align on Easting
Left Justified
Got a question? Visit the Seequent forums or Seequent support
© 2023 Seequent, The Bentley Subsurface Company
Privacy | Terms of Use