
Maps
More than Printed Sheets of Information
Oasis montaj mapping capabilities are the result of decades of programming development, and the options for producing and editing maps — as well as the quality of output — reflect this level of experience. You can use the system to produce a variety of professional presentations quickly and easily. Physically, a "Map" is a special graphic file (MAP File) containing drawings and images.
However, you should also be aware that in Oasis montaj, a "Map" is more than a printed sheet of information; the Map view gives you a working area for analyzing and visualizing your data and information, it enables you to edit it interactively, apply dynamic linking and track the map creation processes. Maps are special items that serve a number of purposes in the system.
How do Maps Work?
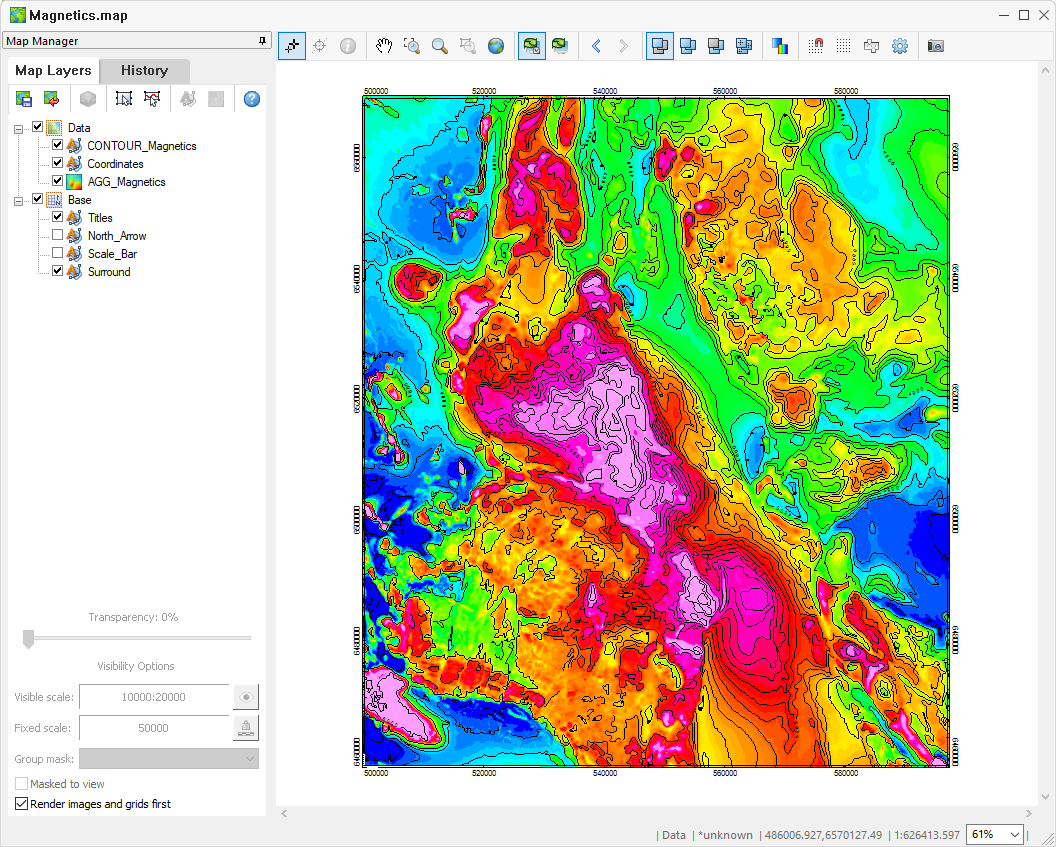
When you create or open a map in Oasis montaj, the system displays a Map window in the project. For a new map, the window is initially empty. For an existing map, all map elements are displayed when the window opens.
After a Map window is open, you can add a wide variety of data and basemap-related information. The Map window provides the basic mechanism for creating maps, images and linking to other maps and data. Secondly, it provides a means of editing graphics, adding text and creating highly customized final presentations for output to printers and plotters.
Understanding the Parts of a Map
To work effectively with maps, you need to be familiar with the purposes of them as well as the role of "Views " and groups (or layers).
Oasis montaj maps handle each type of information differently so you will find that there are two distinct views in the system. The Data view manages all map entities related to data and ground coordinates (such as grids, symbols and lines, etc.) and the Base view manages all entities related to base maps and plotting coordinates (such as title blocks, legends, etc.).
As you use the system, you will become familiar with the information that is stored in each view and how to manipulate views (for example, by turning off map elements for plotting purposes).
Base and Data Views
Maps use views to organize and display information. A view divides the information on a map into a Base view, which uses paper coordinates, and a Data view, which uses ground coordinates.
What's in each view?
Map surrounds, north arrows, and scale bars are examples of map groups plotted in the Base view.
Map coordinates, contours, and grids are examples of map groups that are plotted in the Data view.
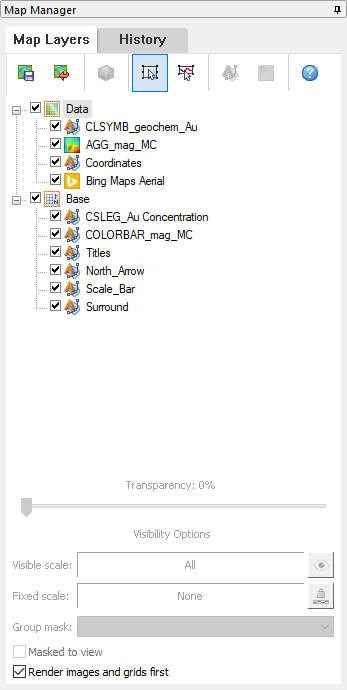
You can use the Map Manager tool o create, edit, move, hide, and mask the groups in each view.
Groups
How Maps use groups to display information
You can create, edit, move, hide, and mask groups. You can also move groups in front and behind each other. Any new object you add to a map, such as a polygon or line, is added to the current group.
How are groups displayed?
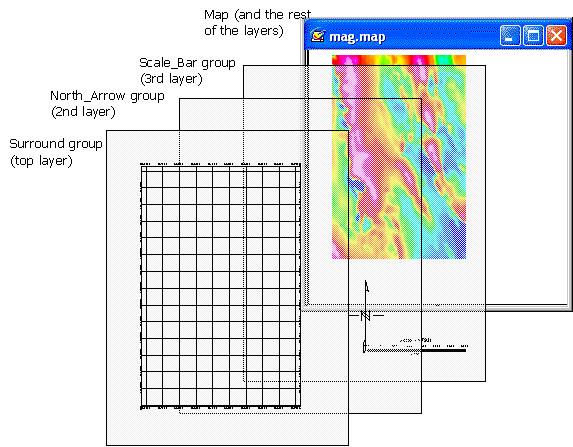
Groups are layered on top of each other in a specific order determined by the Map Manager tool, as shown in the image below.
The graphic below shows how the order in which each group is drawn on the map is determined by the order in the Map Manager.
"True Transparency"
Oasis montaj supports "true transparency", which is automatically enabled for users who have video cards that support it. For users who don't have true transparency supporting video cards, the "Light Table" display technology is used.
Each group or layer in a map has individual transparency settings controlled from the Map Manager tool. These transparency settings affect both 2D and 3D raster images and vector line work.
Got a question? Visit the Seequent forums or Seequent support
© 2023 Seequent, The Bentley Subsurface Company
Privacy | Terms of Use