
Understanding the Parts of a Map
In Oasis montaj, "Maps" are special items that serve a number of purposes in the system. First, the map window provides the basic mechanism for creating maps, imaging and linking to other maps and data. Secondly, maps provides a means of editing graphics, adding text and creating highly customized final presentations for output to printers and plotters. To work effectively with maps, you need to be familiar with the purposes of maps in the system as well as the role of views and groups.
When working with maps, you can add, change or delete groups and graphics items (such as lines, text or polygons) or attributes (line thickness, font, etc.) in one or more views. Before working with maps, you should be familiar with the hierarchy of views, groups, graphics items and aggregates in Oasis maps.
Map Manager
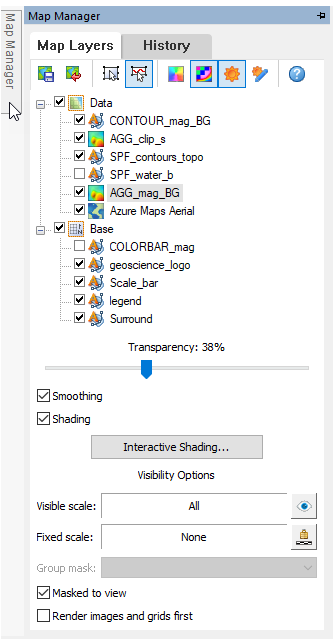
The Map Manager tool, embedded inside every single Map window, shows all the layers contained within the currently open Map document. Any layers that have been added or drawn to the map will be visible in the Map Manager tree.
Map Views
Maps are composed of "views". A view is a coordinate translation and a masking region. By convention, Geosoft maps consist of a ‘Base’ view, which uses paper coordinates with an origin at the paper origin, and a ‘Data’ view, which uses ground coordinates. Map surrounds, for instance, are plotted in Base views and map coordinates contours and grids are plotted in Data views.
Map Groups
Each view may contain a number of graphic groups. A graphic group is a set of graphics elements that make up a graphic component of the map. For example, a line path plot, a contour plot or a profile plot would all be separate graphics groups within the Data view.
Map Layers Tab
Map layers are sometimes referred to as map  icon, which is correlated with the corresponding button on the toolbar that opens the view in 3D Viewer.
Each view often contains a number of map layers or groups. For example, a line path group in ground units will reside in the Data view , while a legend bar defined in cm units will reside in the Base view.
Groups are displayed with an icon representing what type of data is contained in the map group, followed by a unique group name.
-
 vector groups
-
 aggregates
-
 Azure Maps
-
 Esri layers
Examples of map groups in the Base View:
-
North arrows
-
Scale bars
-
Map surrounds
Examples of map groups in the Data View:
-
Images (grids, images, plots)
-
Contours
-
Coordinates
-
Flight lines
Graphics Items
In turn, map groups, such as North arrows and contours, are composed of graphic items (lines, polygons and/or text) that you can select individually and add, delete or change (modify attributes).
Aggregates
The actual data, such as grids in maps, that is required to create a graphical image resides in a special group called an aggregate. An aggregate is simply another layer that contains grids and images.
Aggregates are special because you cannot add or delete elements from them but you can manipulate them. For example, Oasis montaj enables you to modify the colour zone or modify symbol colour schemes interactively using a special tool called the Colour Tool, add shadows interactively using the Shading functionality.
As a further indication of the nature of the group, if it has been generated by an Oasis montaj tool, its name is preceded by the type of entity it represents; for example, a raster data (grid) group or aggregate is preceded by the string AGG_, a line path group is preceded by the string PATH_, while a symbol plot is preceded by the string SYMB_.
You can use the Map Manager to edit raster and vector layers, to rename or remove layers, and to change the appearance, transparency and visibility options for any map layers displayed in the Map document:
-
Right-click on any of the layers in the tree and perform simple operations like Zoom to Selection, Delete Group, Rename, or make the layer Movable.
-
Right-click on a vector group layer and the Edit Vector Group and Export to GDB context menu options are activated.
-
Right-click on a selected AGG_ layer and the following context menu options are activated: Colour Tool, Smoothing, Shading, and Interactive Shading.
- The Interactive Shading menu option becomes available once the Shading option is selected.
To select single layers in the tree, click on the intended layer and it will be highlighted to indicate your selection. Multiple selections of layers or groups within a view or at the same level within multiple views can be achieved by holding the Ctrl key and clicking on the desired items. Changing the selection during group editing will end group editing without canceling any current changes.
You can control the visibility of multiple layers by organizing them into folders and sub-folders.New folders can be added to views by right-clicking on the view name. One additional level of folder can be added to folders. Folders can only be two levels deep. Attempting to add a third level will simply not result in any action. The default folder name is "New folder". To change the name of the folder, press the F2 key or double click on the entry. New folders are added to the top-most node of a view or a folder.
Groups from the same view can be dragged and dropped into folders by panning the cursor to the folder name (in which case they will always append at the top) or to any point in the folder tree, provided it is expanded. Dragging and dropping groups into a collapsed folder will always expand the folder; all contained folders and layers will retain their original collapsed or expanded state.
Folders within the same grouping can be moved out of their parent folders into either the main tree or another parent folder.
Layers on a map are rendered in the top-down order of the groups in the Map Manager. The render order of views, folders, and groups can be changed by dragging and dropping them at the desired location. Modifying the rendering order also works for multiple selected groups.
Display Layer(s) in 3D View
When dragging and dropping map groups from plan or section oriented maps, begin by dragging a single group (or a selection of groups) from the Map Manager tool and dropping them into the 3D Viewer window.
When content is displayed in the 3D Viewer:
-
The name of the new plane is that of the source map’s data view.
-
If the 3D view contains more than one plane, Oasis montaj checks to see if a plane of the same name as the data view already exists and if so adds to it; otherwise, it creates a new plane with the data view name.
-
Assuming the existing plane and source orientation are identical, if the 3D View already contains a group of the same name, then it gets added to it with the same name but has a numeric value appended to it, i.e., _1, _2, etc.
Map Layers Tab Options
Toolbar |
||
|
|
Save Changes |
Saves changes to the map. |
|
|
Discards changes made to the map. | |
|
|
Open 3D view er |
Enabled when a 3D view is selected. Click on the button to open the view in the 3D view er. |
|
|
Select view Mode |
Click this button to switch between views (e.g., Data view (ground coordinates), Base view (map coordinates) , Section view , etc.). |
|
|
Select Group Mode |
Click this button to select the different groups in a Map (rasters, vectors, and other graphics layers). Once selected, you can move, cut, copy or edit the group. |
|
|
Edit Vector Group |
Click this button to start editing the selected vector group. |
|
|
Colour Tool (Edit Raster) |
Click this button to activate the Colour Tool for the selected raster image.
|
|
|
Smoothing |
Click this button to toggle the "smoothing" option on/off:
|
|
|
Adding a shading effect to the colour grid (AGG_layer) emphasizes the subtle changes in the data that would otherwise be subdued. Click this button to toggle the "shading" option on/off:
|
|
|
|
Interactive Shading |
If the Shading option is active, this button becomes enabled. Click on the button to activate the Interactive Shading tool and proceed to change the sun angle in real time. |
|
|
Help |
Opens this Help topic. |


Display Options |
||
|
|
Transparency |
When a group is selected, the transparency slider becomes enabled. Initially all groups are opaque. Use the slider to modify the transparency of the selected group. |
|
|
Smoothing |
When an aggregate (AGG_ group) is selected, this option becomes enabled and acts as a toggle to turn on/off image smoothing:
The intial state of this option is set during the process of displaying the colour image on the map. |
|
|
Shading |
When an aggregate (AGG_ group) is selected, this option becomes enabled and acts as a toggle to turn on/off image shading. Shading emphasizes the subtle changes in the data that would otherwise be subdued.
|
|
|
Interactive Shading |
Enabled when an aggregate (AGG_ group) is selected and the Shading context menu option is selected. Click this button to activate the Interactive Shading tool and proceed to change the sun angle in real time. |
Visibility Options |
||
|
|
Visible scale |
Click this button to set a scale range in which the currently selected Group will be visible.
|
|
|
Fixed scale |
Click this button to freeze the scale of the currently selected Group, at a specified value.
|
|
|
Group mask |
Select a group mask region from the list to mask selected group(s) within the view to the specific named area. Select "None" to remove the masking from the selected group(s). Group masking provides a way to hide certain parts of a map without the need to edit or subset the original data. |
|
|
Masked to view |
Every map has a default "view mask" that is the rectangle of the data extents. This is the mask used when you select the [Masked to view] option. |
|
|
Render images and grids first |
Check this box to render (draw) any raster images and grids first (i.e., as the bottom layer). |


History Tab
This tab is used to keep track of your map editing and provides unlimited undo/redo functionality.

Docking Behaviour
-
The Map Manager tool can only be docked to the left side of maps.
-
It can be "pinned" - open or "unpinned" - displayed as a tab on the left side of the map.
-
It cannot be closed.
-
It cannot be a floating window.
Got a question? Visit the Seequent forums or Seequent support
© 2023 Seequent, The Bentley Subsurface Company
Privacy | Terms of Use