
Database Dynamic Linking
Database linking is designed for selecting a data point from a map — the system automatically scrolls through the line/group in the linked database to show the corresponding data point each time you select a location on a map.
You can only use Database Dynamic Linking if your map contains group linking items (i.e., survey lines, symbols, down hole sections or ArcGIS LYR files).
The advantage of database linking is that you can quickly navigate through your database or select an anomaly on a map, and you can immediately see the linked data in all three views: Spreadsheet, Profile and Map. This enables a rapid evaluation for further processing and interpretation of the data.
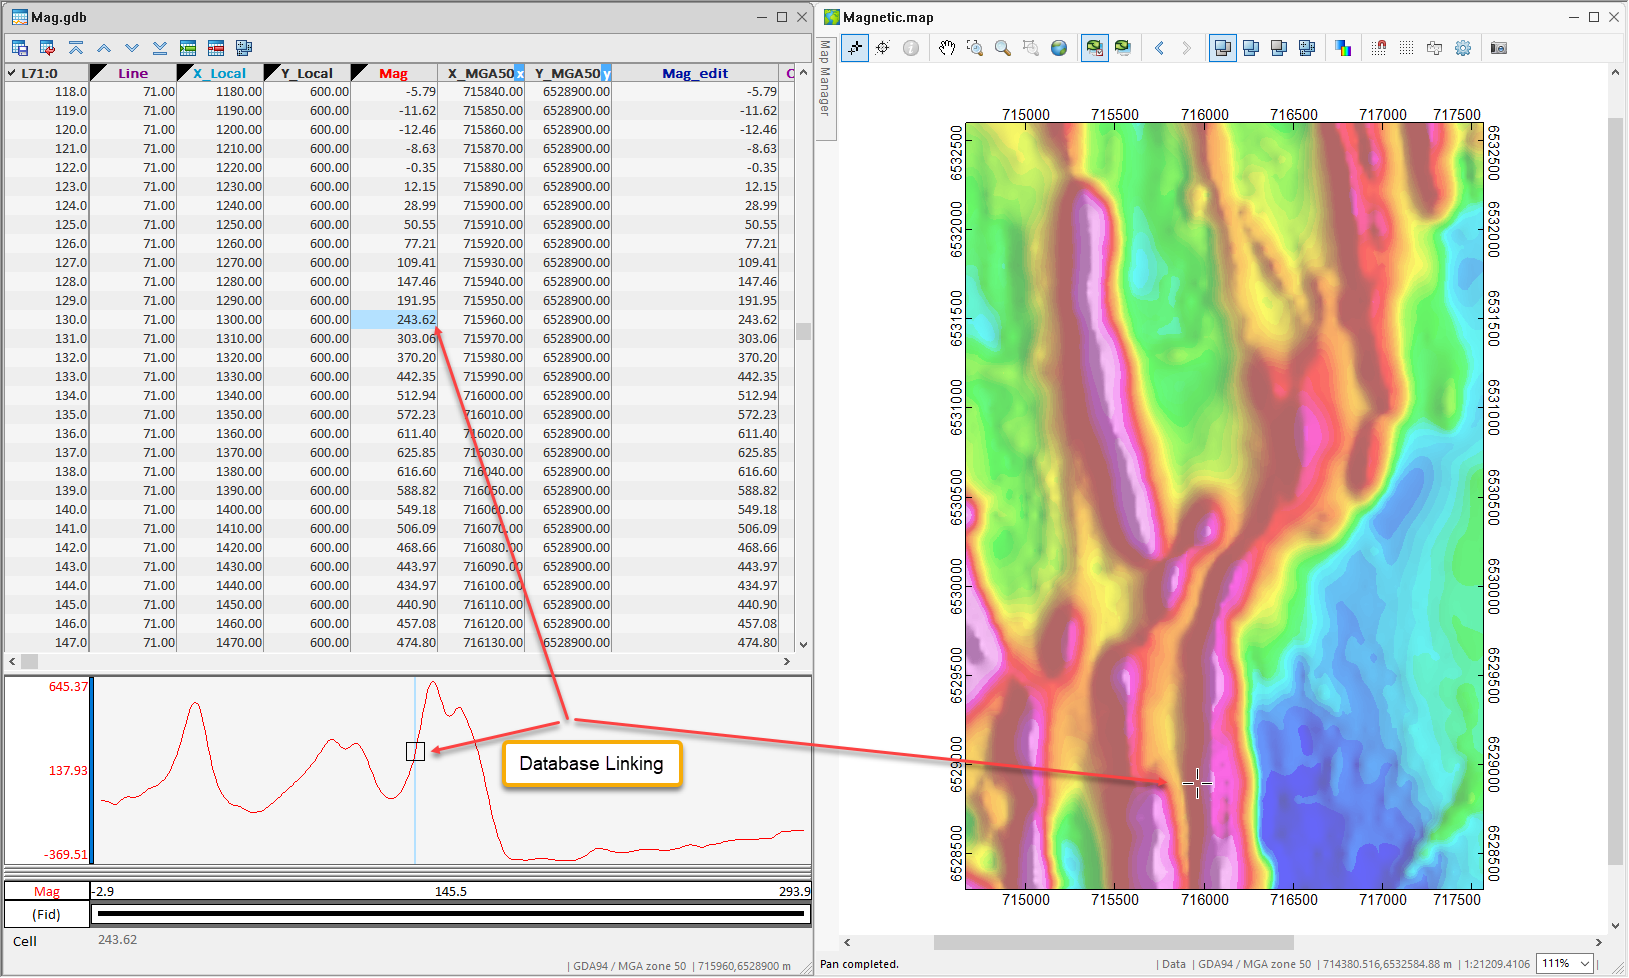
With a database open, if you select a value in the database spreadsheet or a point in a profile, you will see a “shadow” cursor highlighting that same location on the maps. This type of linking gives you a quick way of visualizing discrete anomalies from a specific line in the database. Note that if you are using random data, you can use this functionality to locate a station and all corresponding data (you do not require survey lines, symbols or other linking groups on your map).
The following illustrates an example of a map with survey lines and the corresponding database and profile values selected.
This type of linking gives you a quick way of:
- visualizing anomalies from a spreadsheet, profile or map.
- selecting a range of data values for processing or analysis; use the cursor to click and highlight points in the profile, and see the same range of data in the spreadsheet or vice versa.
Data Linking
Use the Data Linking ( ) button to create a dynamic link between your maps and databases (in Spreadsheet and Profile windows) to assist in locating and comparing data, profiles and maps.
Down Hole Linking
This technology also enables you to track your down hole data in section plots and plan maps. For example, if you have plotted a section on your map, you can use this button to link to the down hole data in the database and profiles.
When a point is selected on the map, the cursor will ‘snap to’ the nearest data point, and this location is highlighted with a “shadow” cursor on the other open maps and grid viewers; in the linked database (spreadsheet and profile) that data point is highlighted, automatically changing the visible line/group as required.
When more than one data linking items are currently displayed on your map (i.e. line path, symbol plot, drillhole section plot, ArcGIS LYR file), the Select a Group for Linking dialog will be displayed. Use this dialog to select a group for dynamic data linking.
See Also:
Got a question? Visit the Seequent forums or Seequent support
© 2023 Seequent, The Bentley Subsurface Company
Privacy | Terms of Use