Visualising IMDEXHUB-IQ™ Data in the 3D Scene
Some Central projects have permission to access an IMDEXHUB-IQ™ integration. With this integration, you can visualise data collected at rig in near real time alongside geological data in the Central Portal. Data types supported are drilling data, planned holes, survey measurements and structural data.
This guide describes how to visualise IMDEXHUB-IQ data in the Central Portal’s 3D scene.
For an introduction to working in the 3D scene, see the Visualising Data in the Central Portal guide.
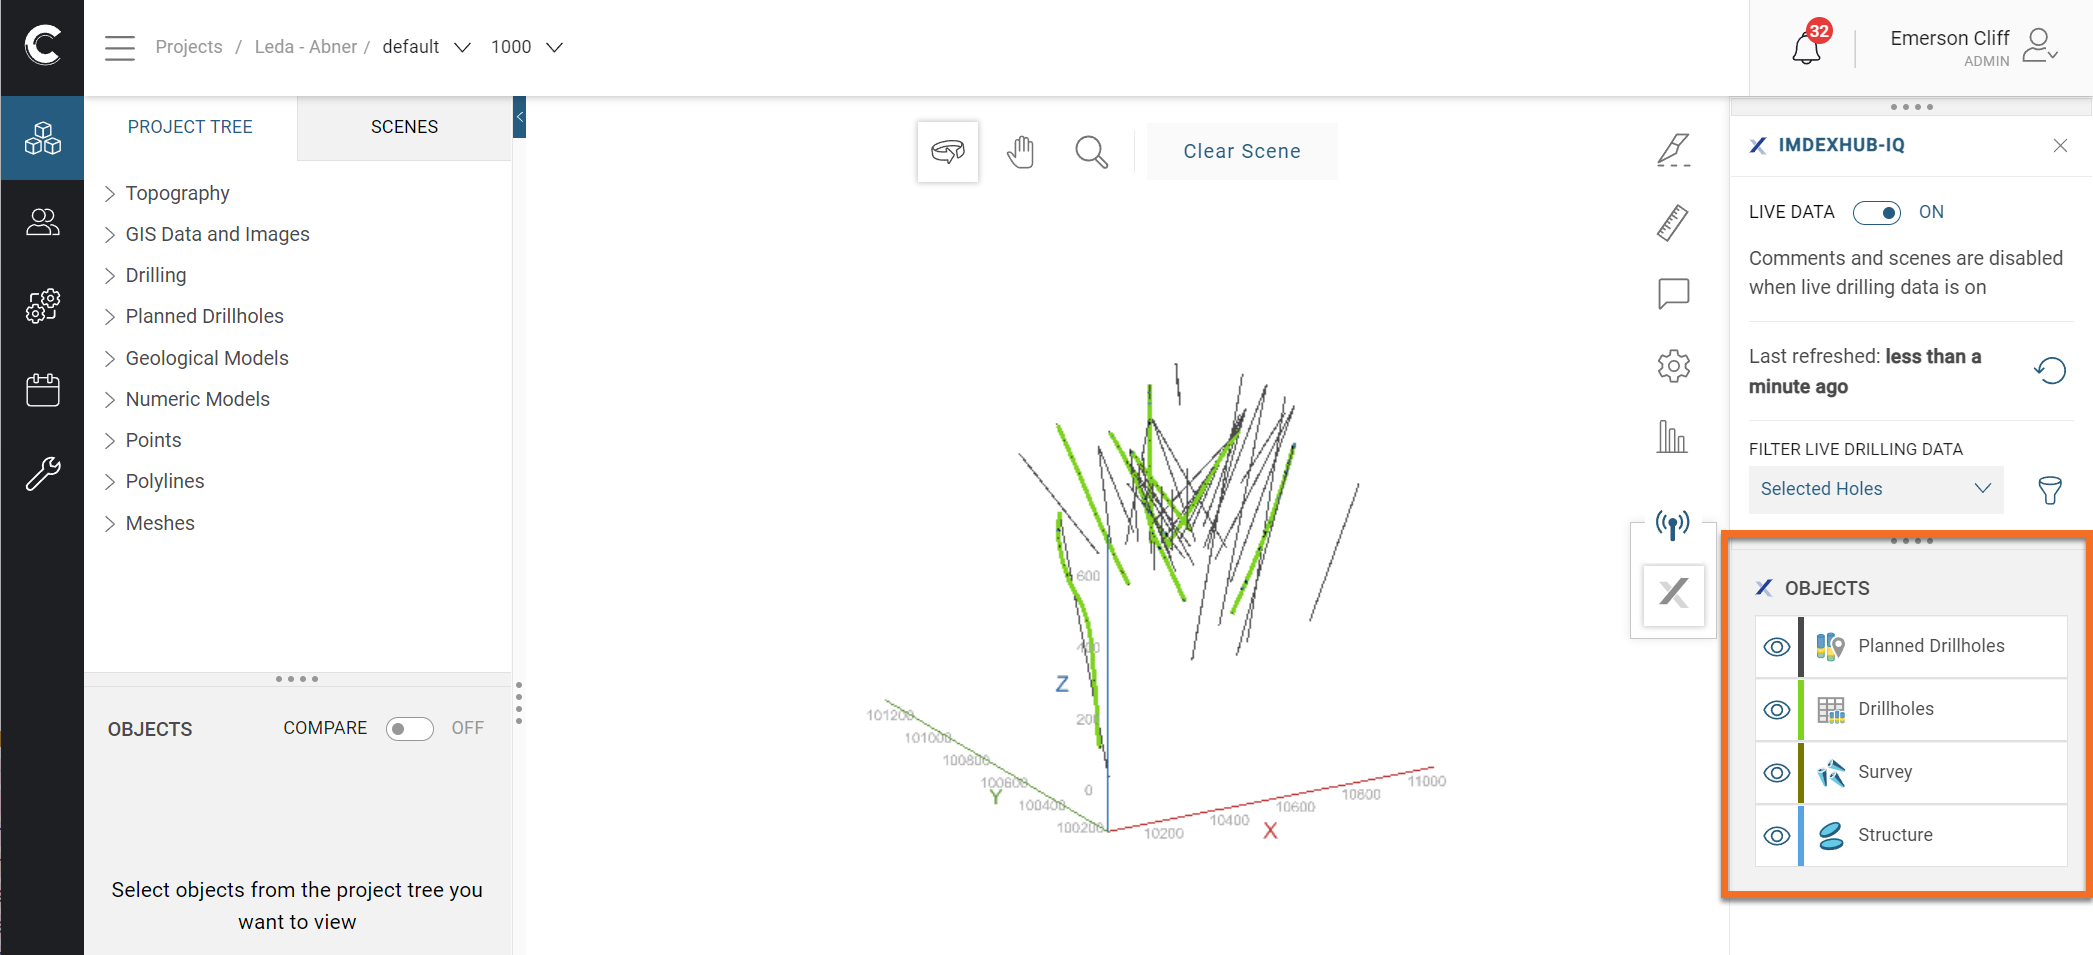
Central projects with an IMDEXHUB-IQ integration have an extra tool in the tool strip on the right-hand side of the 3D scene:
If this tool does not appear for a project you are certain should have an integration, contact your Central administrator. It may be that the integration has not been added to the project. For information on setting up an integration, see the Managing IMDEXHUB-IQ Integrations guide.
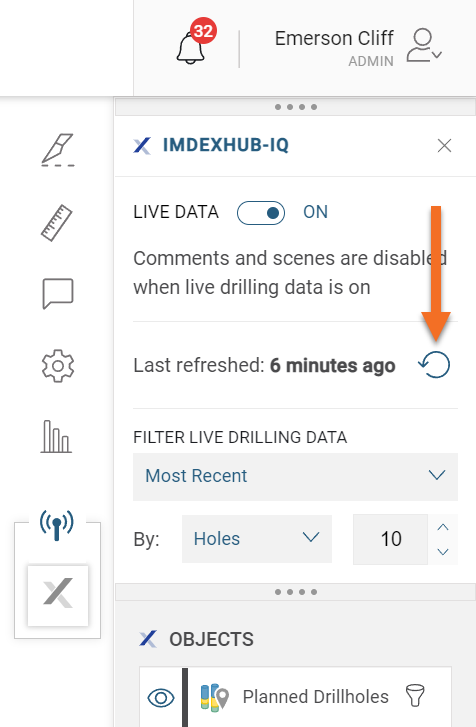
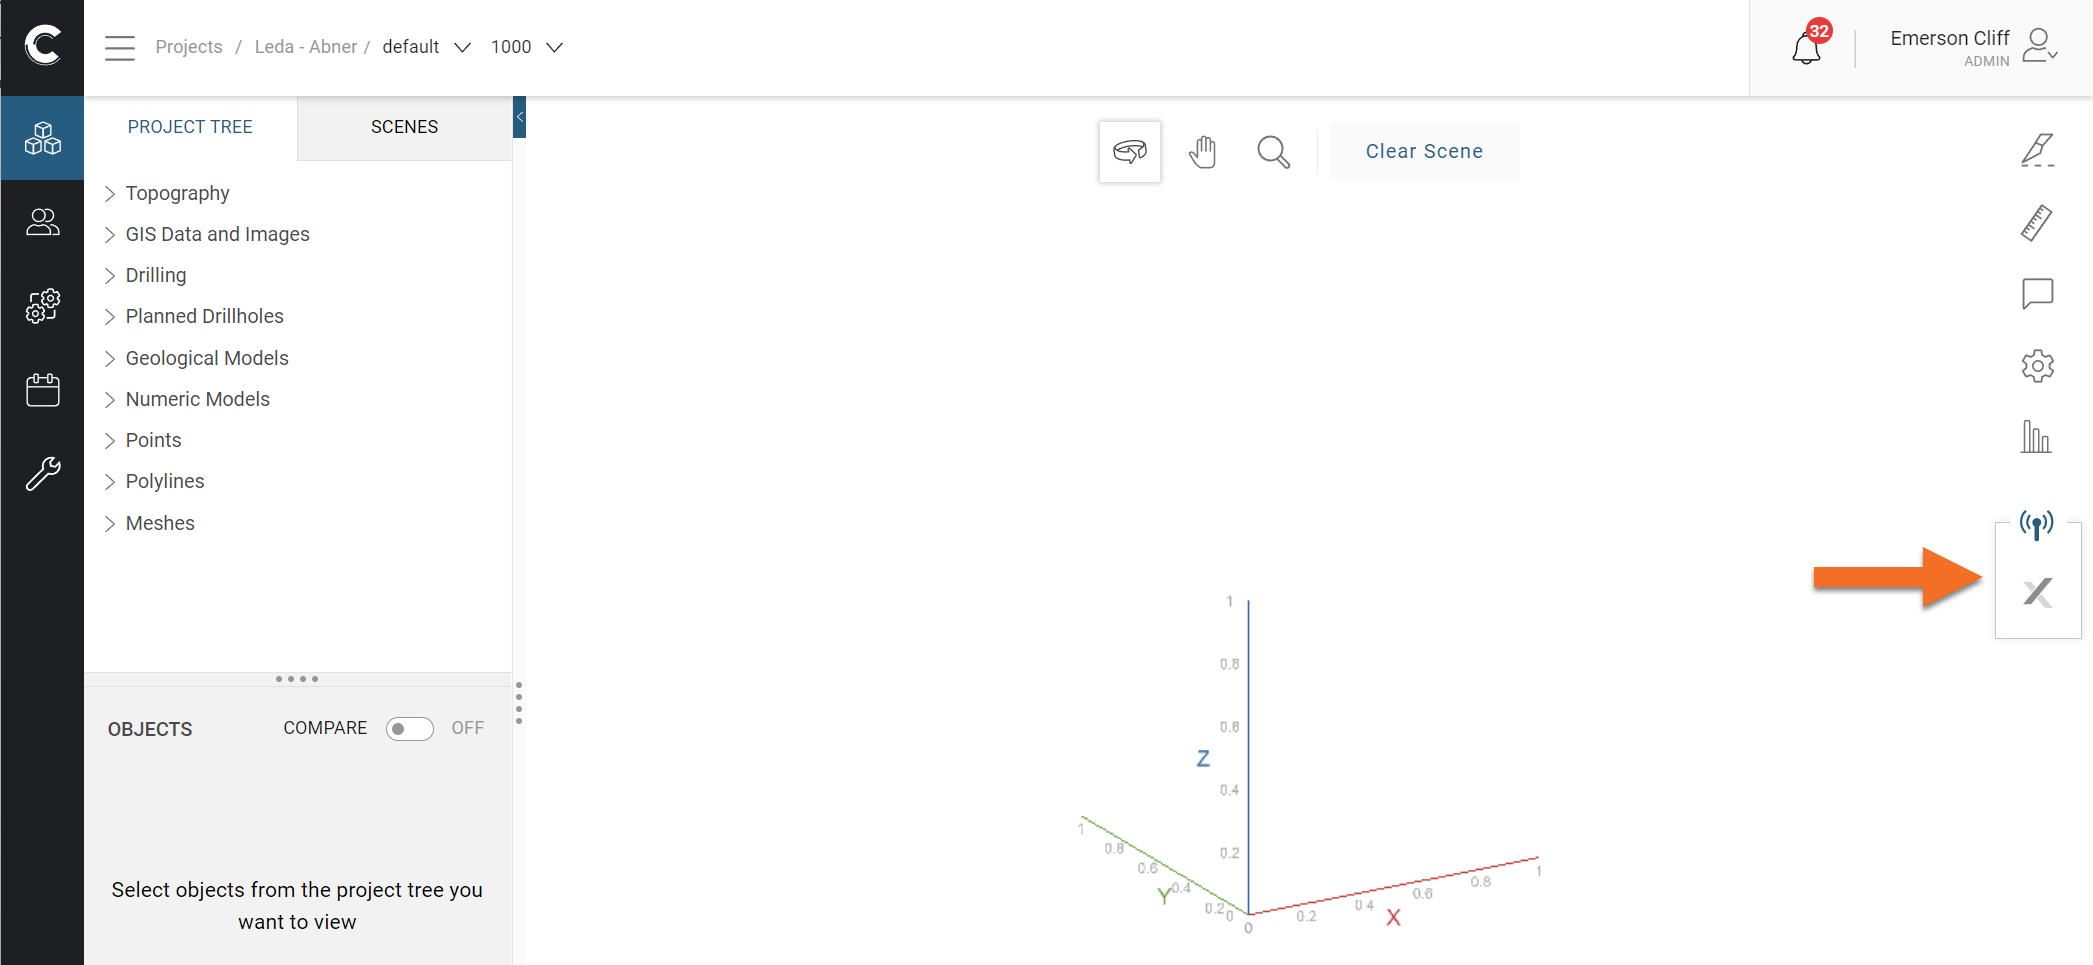
Click the tool (![]() ) to open the IMDEXHUB-IQ panel. This loads the integration and displays the available data:
) to open the IMDEXHUB-IQ panel. This loads the integration and displays the available data:
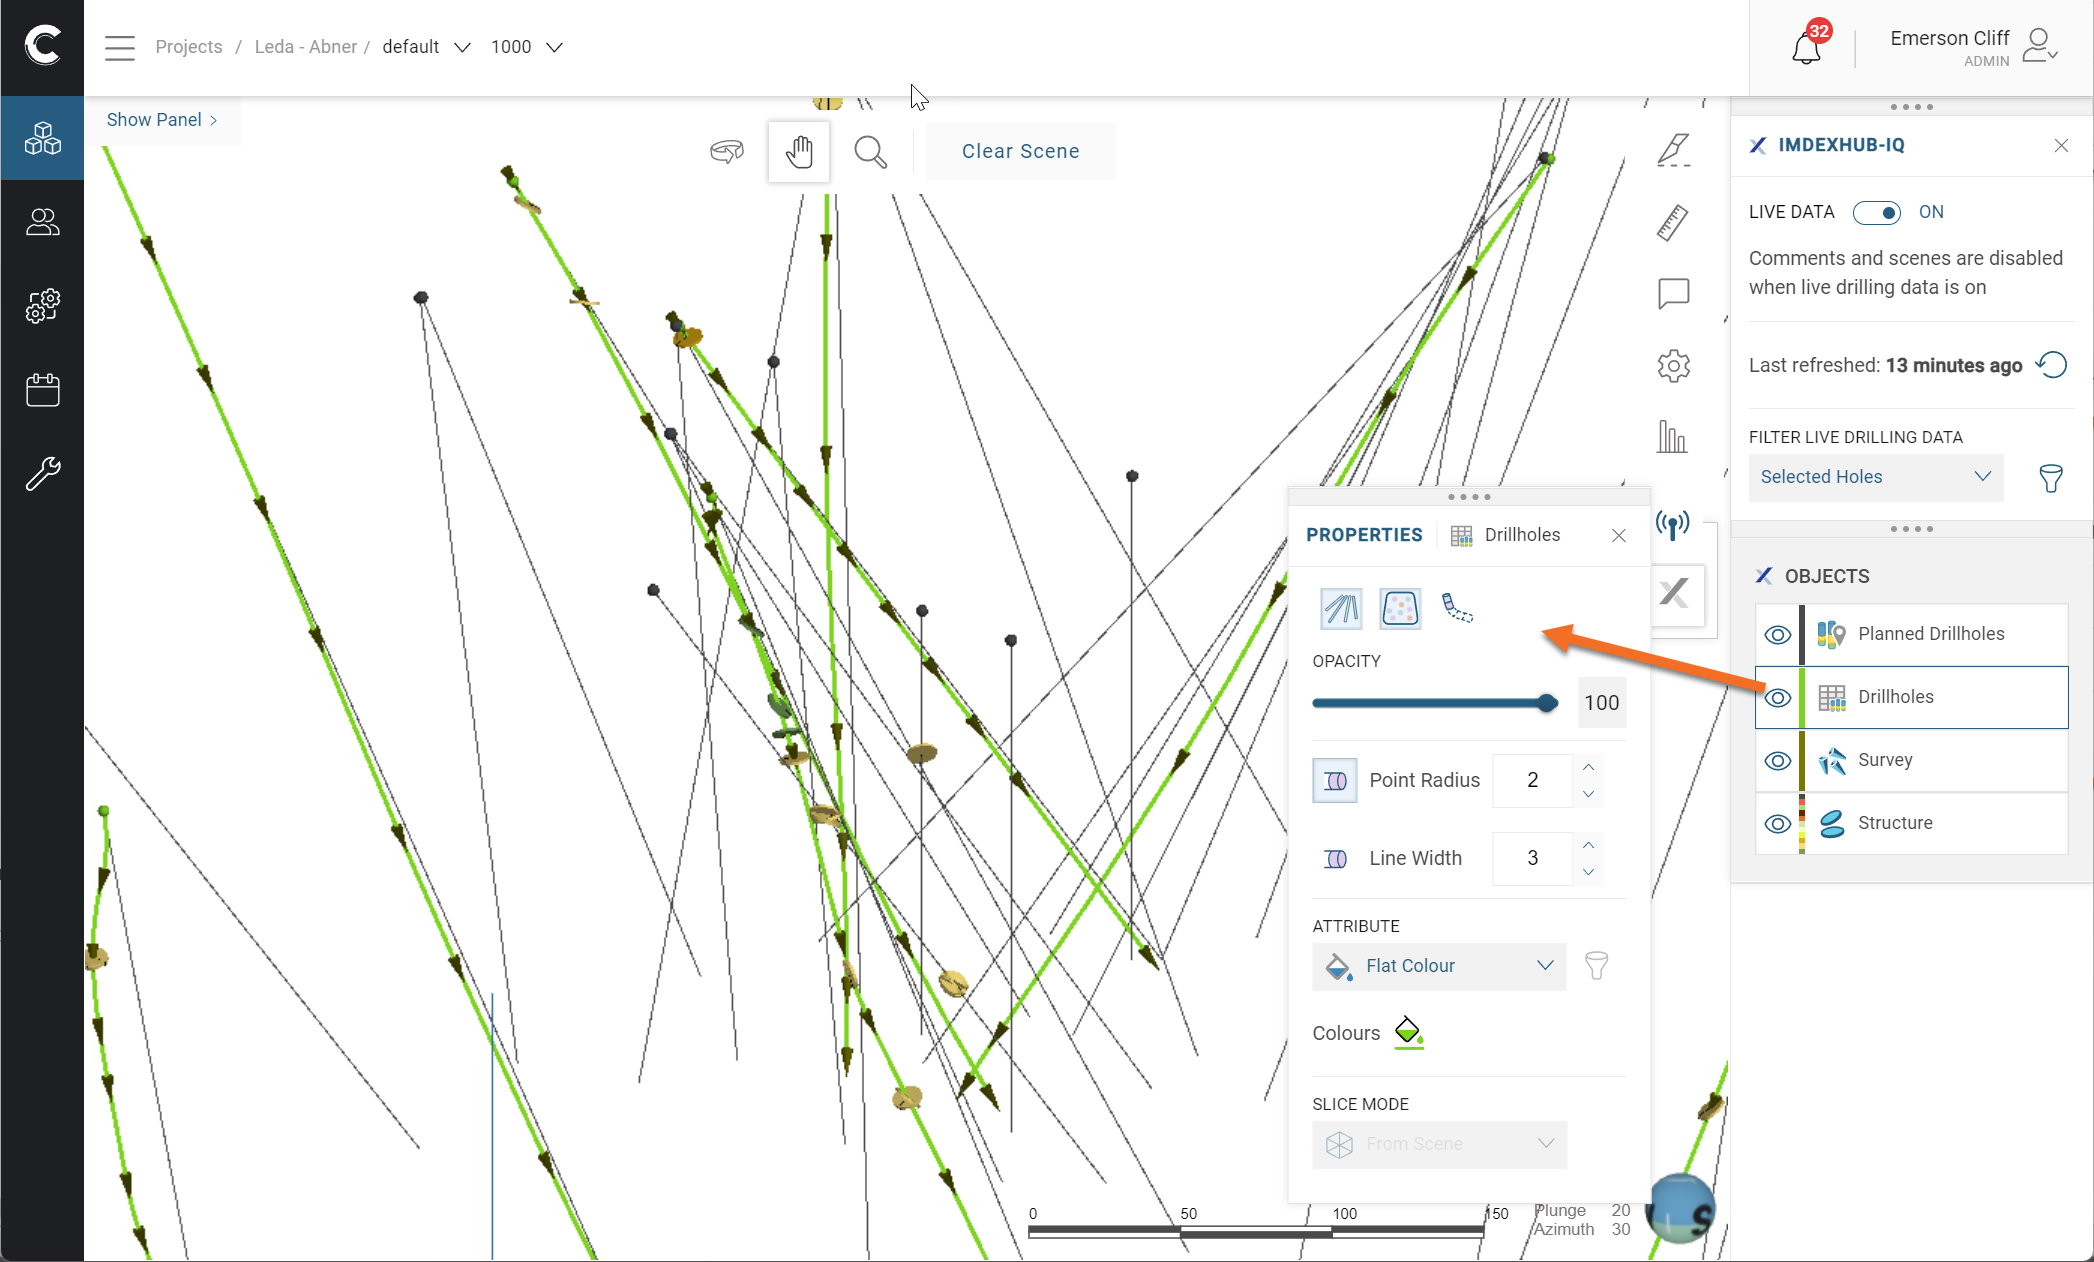
Click on an object to view its properties and change how it is displayed:
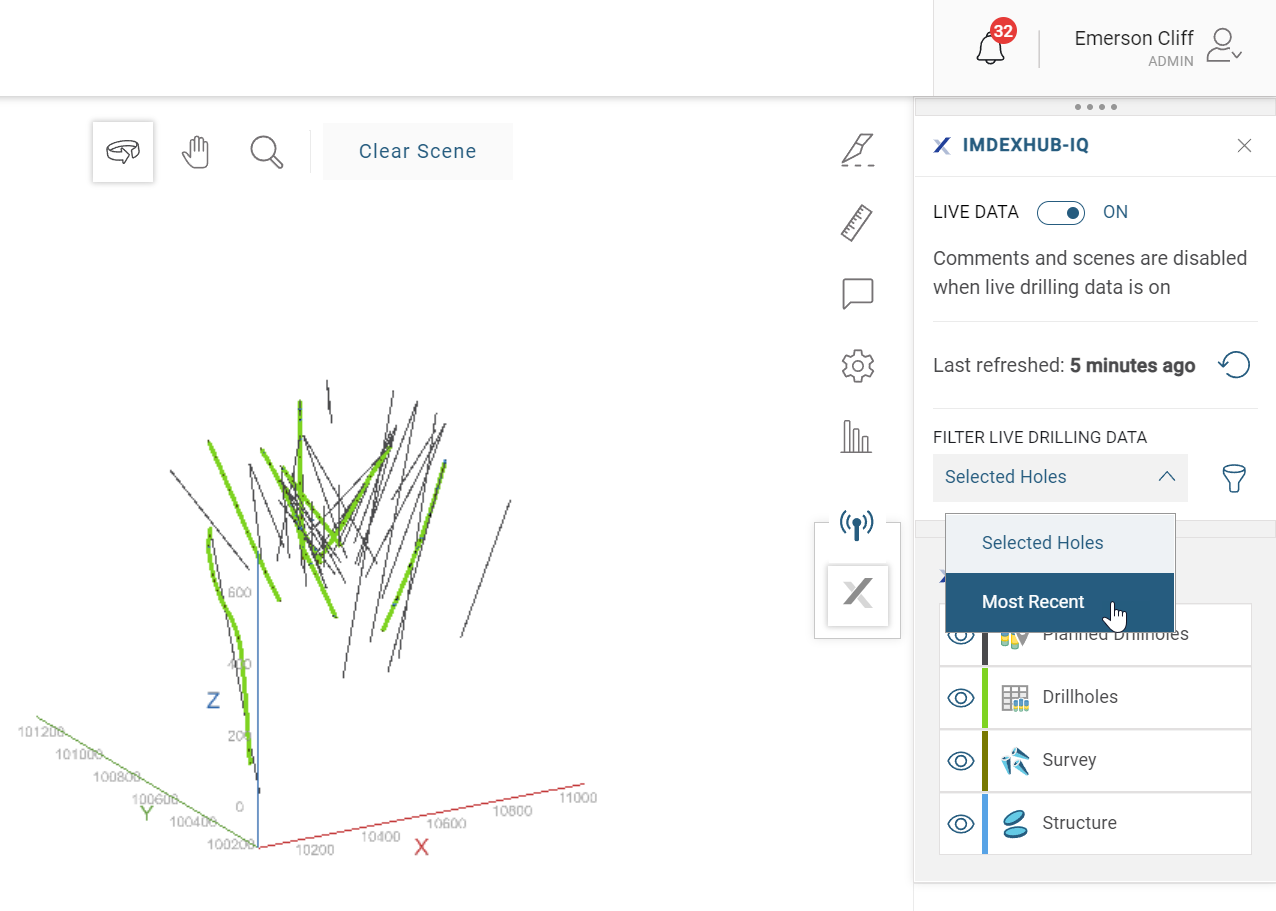
There are two options for filtering drilling data, a selection of all available holes and the most recently drilled holes:
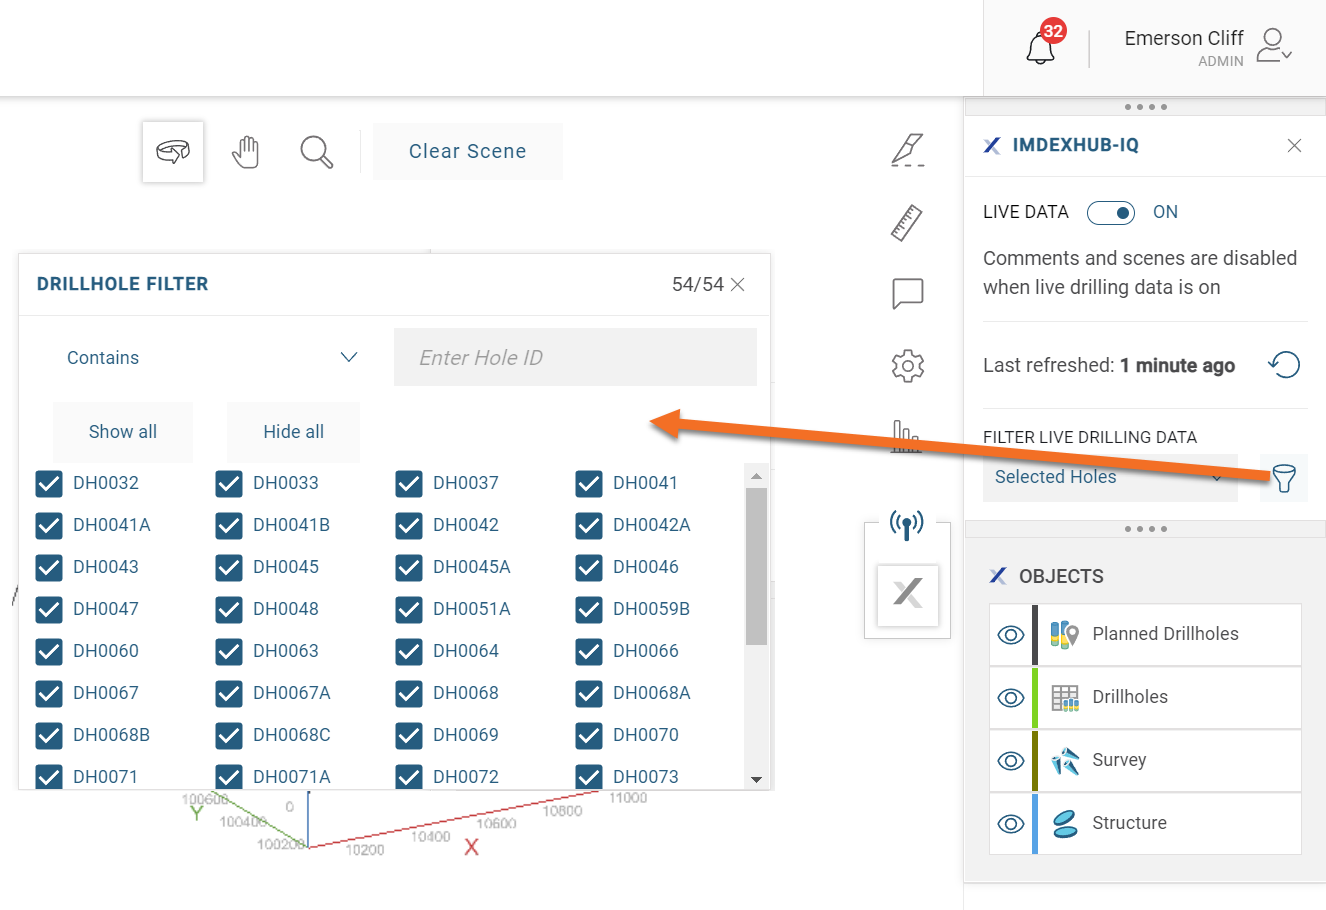
For the Selected Holes option, click the filter button (![]() ) to display a list of all the drillholes in the project and choose a subset to work with:
) to display a list of all the drillholes in the project and choose a subset to work with:
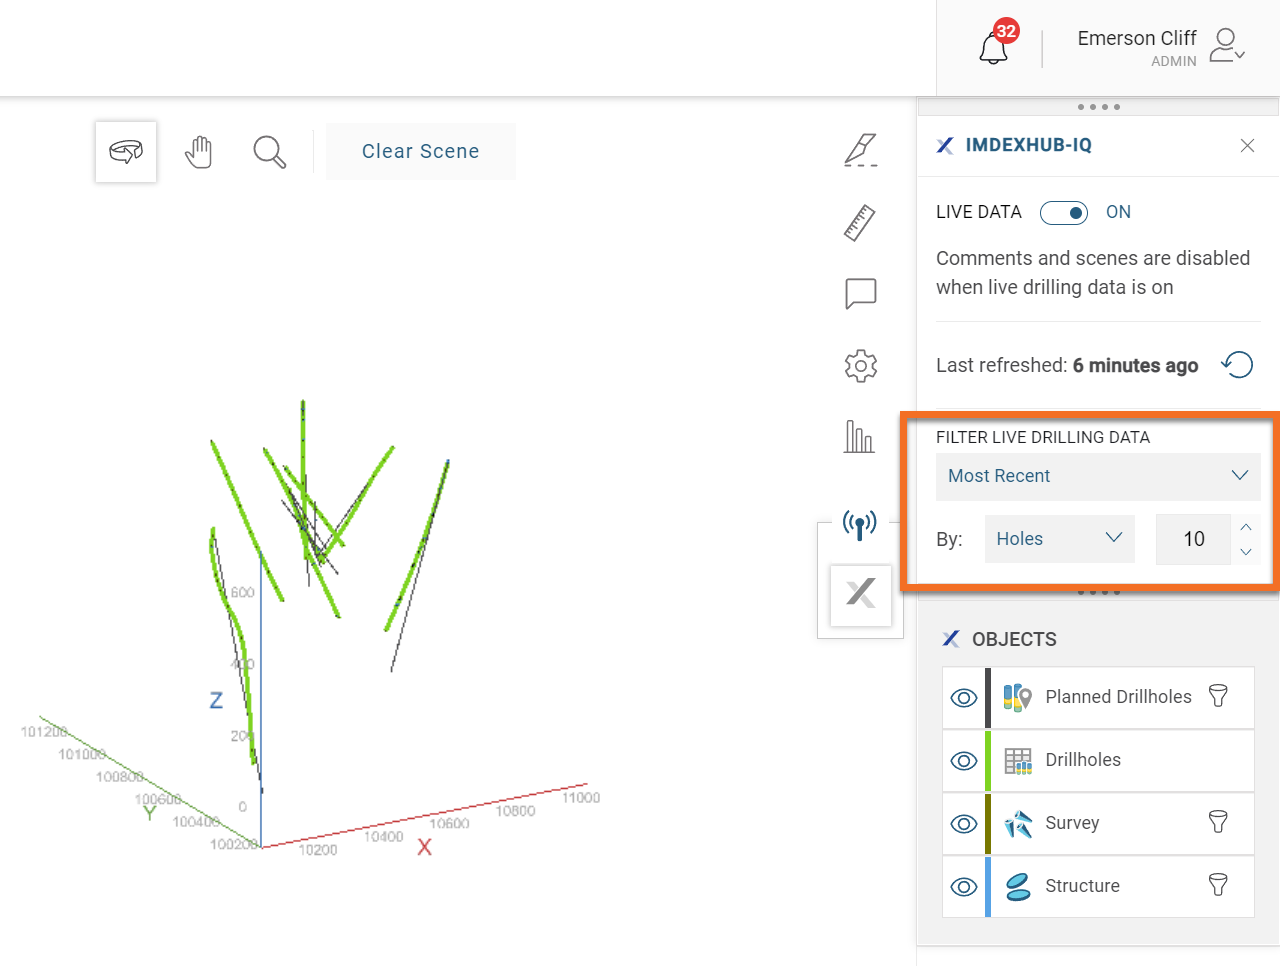
For the Most Recent option, you can filter by days or by holes. Here the last 10 holes drilled are displayed:
Click the Refresh button (![]() ) to view the latest live data:
) to view the latest live data: