
Visualising Data in the Central Portal
You can view project data in the 3D and discuss it with your team using the Central Portal’s 3D scene. This guide describes the basics of displaying data in the 3D scene; it is divided into:
- Navigating in the Scene
- Navigating Between Branches in the 3D View
- Adding and Organising Data in the Scene
- Changing How Data is Displayed
- Displaying GIS Data
- Changing 3D View Settings
There are separate guides that describe:
- Drawing Slices in the 3D Scene
- Measuring Data Objects in the 3D Scene
- Comparing Data in the 3D Scene
- Visualising IMDEXHUB-IQ™ Data in the 3D Scene
- Exporting Surfaces From the 3D Scene
The Collaborating with the Team guide discusses how to use comments and scenes to collaborate with others in your team.
To start working with data in the 3D scene, click on Projects in the sidebar, then select a project. In the project’s Overview tab, click on a revision ID to open its 3D view.
See Viewing the Project History in the Branching in Central Projects guide for information on navigating in the project history.
The 3D view window is divided into:


|
The scene, which may have only axis lines and a compass ball displayed, if there are no objects in the scene. You can choose whether or not the scene has these overlays in the Settings panel. See Changing 3D View Settings below. |

|
The Project Tree panel, which is organised into folders, and the Objects panel. Folders will only appear in the project tree for the types of objects that have been published for the selected revision. Click an arrow to expand a folder and view its contents. Add objects to the scene by clicking the add button ( |

|
The Scenes panel, behind the Project Tree panel. This shows all the scenes that have been set up for the project. See An Introduction to Comments and Scenes in the Collaborating with the Team guide for information on how scenes are used in projects. |

|
A strip of tools for slicing and measuring in the scene, commenting, changing scene settings and viewing statistics. Clicking a tool opens a pop-out panel with more options. |
Pop-out panels can be moved by clicking on the four dots along the top of a panel and dragging the panel to where you want to position it. You can also dock a pop-out panel to the right side of the window.
Navigating in the Scene
Use your mouse to navigate in the scene. There are three modes:
- Rotate (
 )
) - Pan (
 ). You can also pan when the rotate tool is selected by holding down both mouse buttons.
 - Zoom in and out (
 ). You can also zoom when the rotate tool is selected by using the mouse’s scroll wheel or by holding down the right mouse button.
The centre of rotation of the scene is the centre of the objects in the scene. To change the point of rotation, click with both mouse buttons down on an object in the scene.
There are also keyboard shortcuts for quickly changing the view:
- To look down on the scene, press the D key.
- To view the scene from below, press the U key.
- To view from north, south, east or west, press the N, S, E and W keys.
Navigating Between Branches in the 3D View
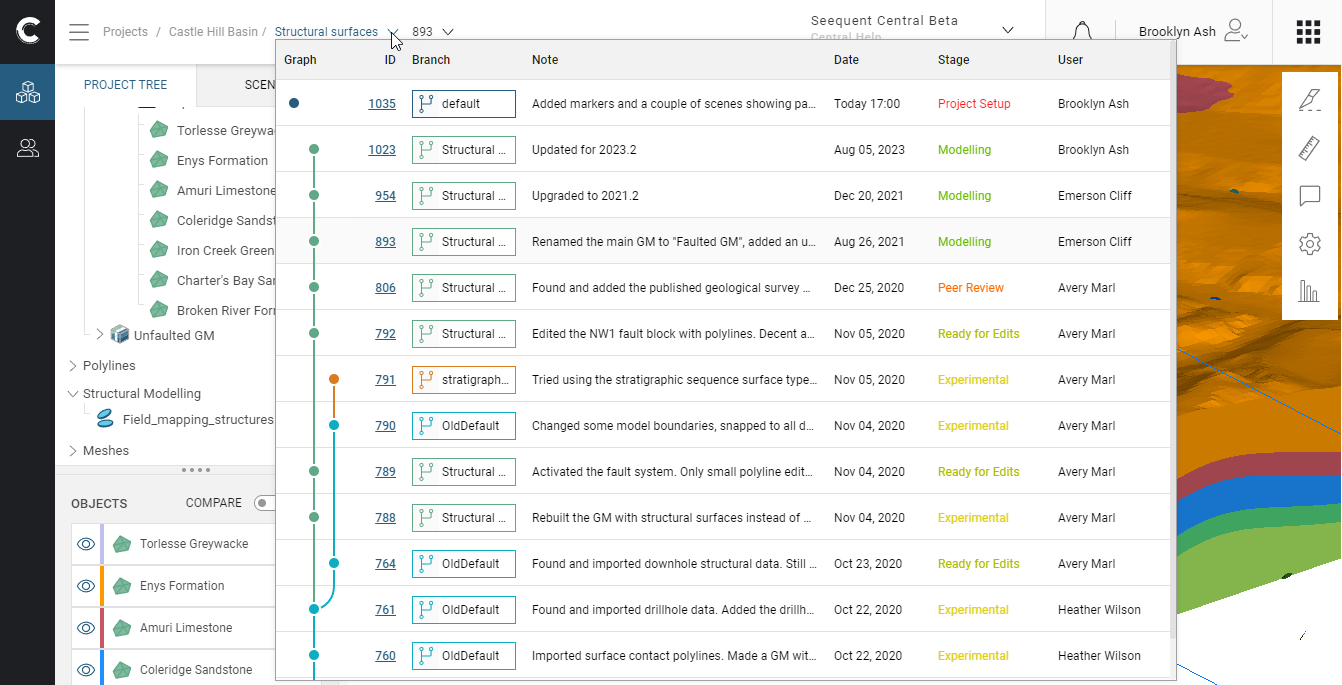
When viewing a revision in 3D, you can move between revisions using the breadcrumbs above the Project Tree/Scenes panel:
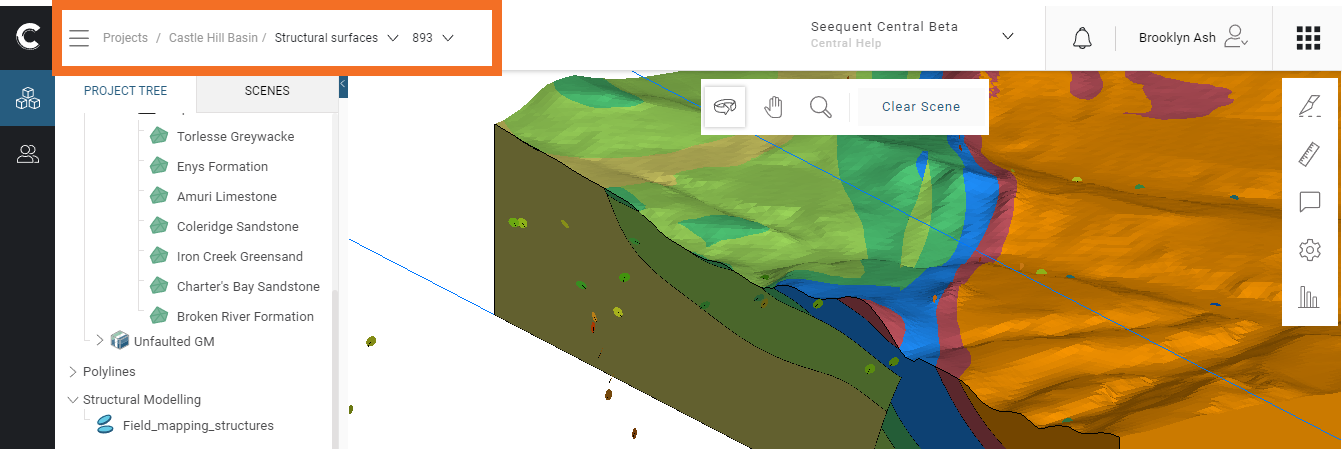
Breadcrumbs are organised as follows:
- Project: Castle Hill Basin in the example above
- Branch name: Structural surfaces
- Revision ID: 893
Click on the revision ID in the breadcrumb to show the other revisions on that branch:
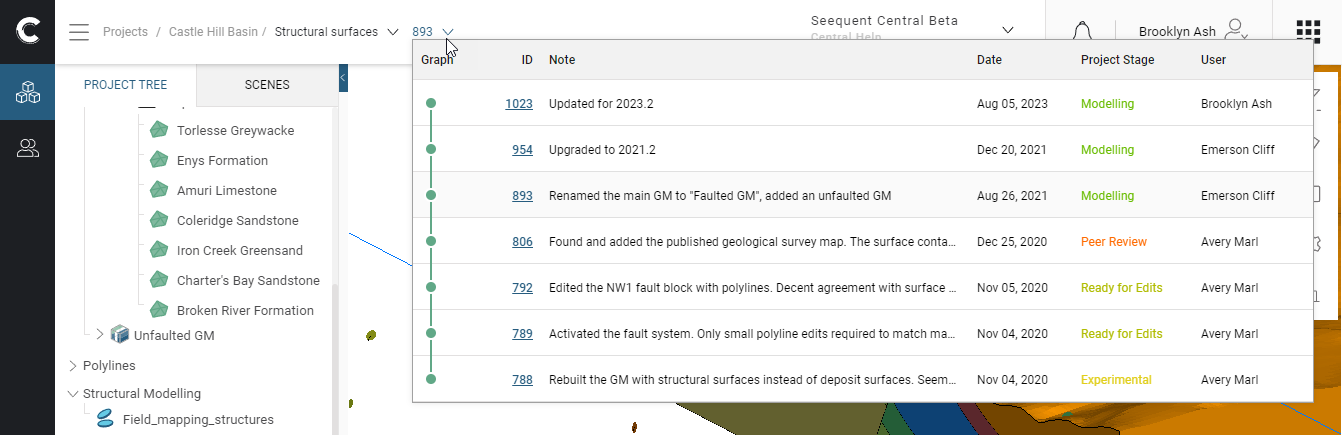
Click on the branch’s name to show the entire project history:
Click on a revision ID to switch to displaying that revision in 3D. If the same objects are present in the newly-selected revision, they will remain in the scene.
Adding and Organising Data in the Scene
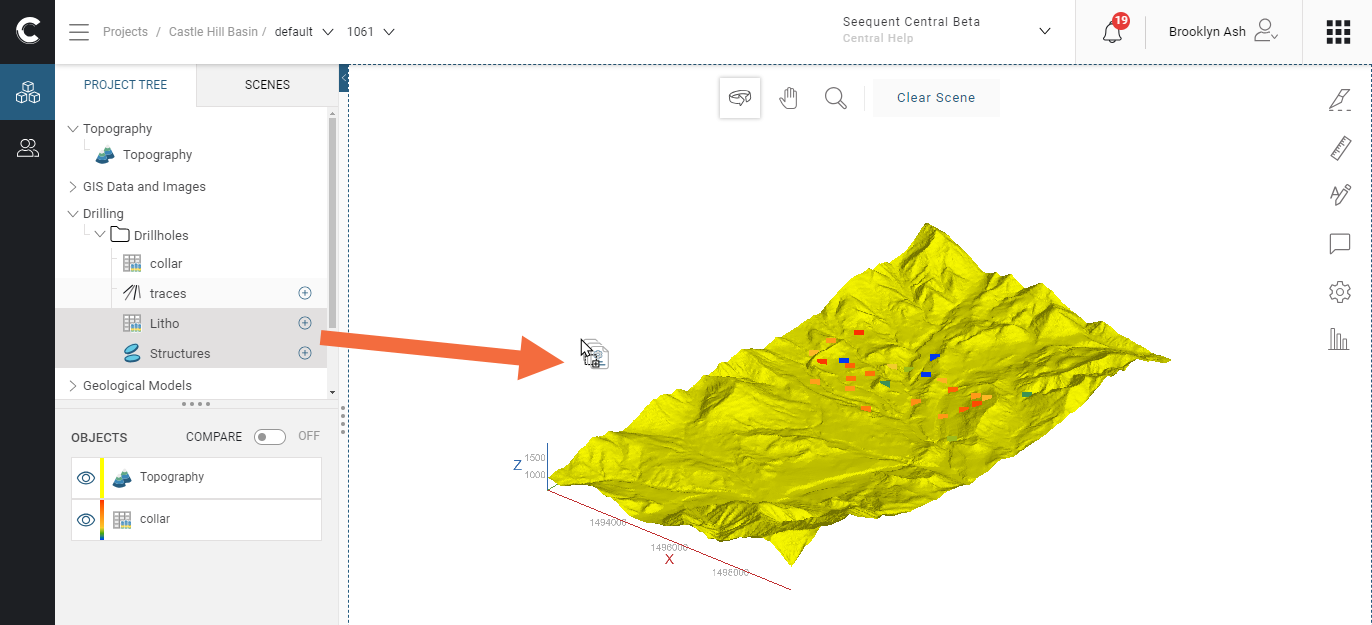
Expand the folders in the project tree to view their contents, and click the Add buttons (![]() ) to add different data objects to the scene. You can also click on items and drag them into the scene:
) to add different data objects to the scene. You can also click on items and drag them into the scene:

You can also select multiple objects and add them to the scene. To do this, hold down the Ctrl key while clicking. Then drag the objects into the scene:
When you add an object to the scene, it appears in the Objects list, where you can:
- Change whether an object is visible in the scene by toggling visibility on and off (
 /
/ )
) - Change how the object is displayed, by clicking on the object in the list to open its Properties panel
There is also an overflow menu ( ) for each object that appears when you hold your mouse cursor over the object:
This gives you options for:
- Removing the selected object from the scene/Objects list. You can also select multiple objects and remove them from the scene. To do this, hold down the Ctrl key while clicking, then click the overflow button for one of the objects and select Remove from scene.
- Locating objects in the scene in the Project Tree. This option is useful for complex scenes with many objects. As with removing objects from the scene, you can select multiple objects to highlight them in the project tree.
- Zooming into the object in the scene to view more detail. This option can only be used on individual objects.
When you remove an object from the scene/Objects list, any changes you have made to how it is displayed will be lost. Toggling visibility on and off (![]() /
/![]() ) for an object is a useful way of working with multiple objects in the scene instead of removing some objects in order to get a better view of others. You can also save a “scene”, which will preserve the display options you have set. This is discussed in Visualising Data in the Central Portal later in this topic.
) for an object is a useful way of working with multiple objects in the scene instead of removing some objects in order to get a better view of others. You can also save a “scene”, which will preserve the display options you have set. This is discussed in Visualising Data in the Central Portal later in this topic.
Changing How Data is Displayed
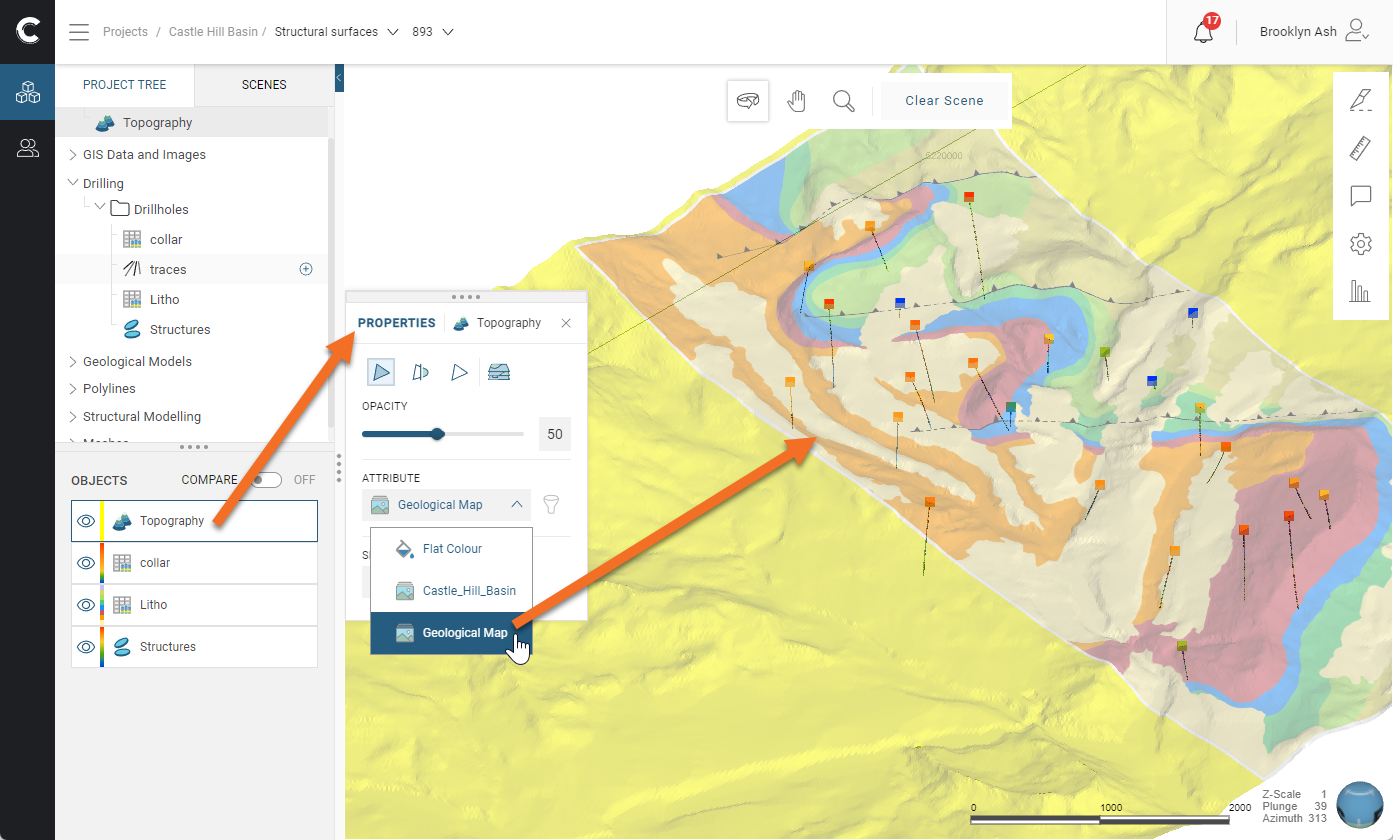
To change how an object is displayed, click on it in the list to open its Properties panel. In this example, clicking on the Topography object opens its Properties panel:
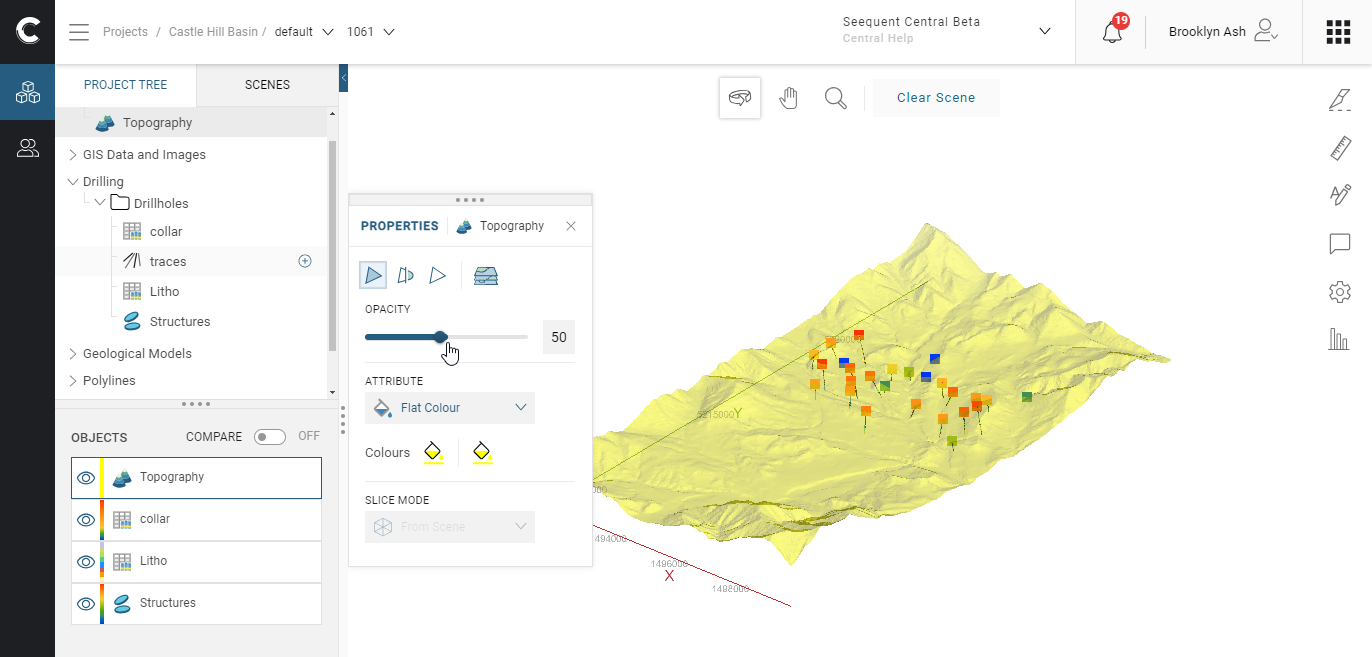
As with other pop-out panels, you can move the Properties panel by clicking on the four dots along the top of a panel and dragging the panel to where you want to position it. You can also dock the panel to the right side of the window.
An important point to remember when adding data to the scene, changing how it is displayed and removing it from the scene is that you are not changing or deleting the data. So feel free to experiment with the different ways of displaying and analysing data, and add scenes so you can come back to points of interest later. For information on saving scenes, see An Introduction to Comments and Scenes in the Collaborating with the Team guide.
An opacity control is available for all object types. Other settings available in the Properties panel depend on the object type. For example, here the Properties panel for the Topography is open, showing that it can be displaying using a flat colour or with the Geological Map image draped on it:
Settings available can include:
- Whether a surface’s triangles are displayed (
 )
) - Whether an object’s text label is displayed (
 )
) - Whether an object’s legend is displayed (
 )
) - Whether a lines object is shown as squares or points (
 ). Clicking on this button also lets you change the size of the object.
 - What colour is used to display an object. This can be a simple Flat Colour or an attribute that uses a colourmap.
When surfaces and volumes are displaying using the Flat Colour option, different colours can be selected for the sides of the object, in order to indicate the object’s polarity, i.e. the inside/outside, younger side/older side. For example, here a contact surface is displayed using blue and green:

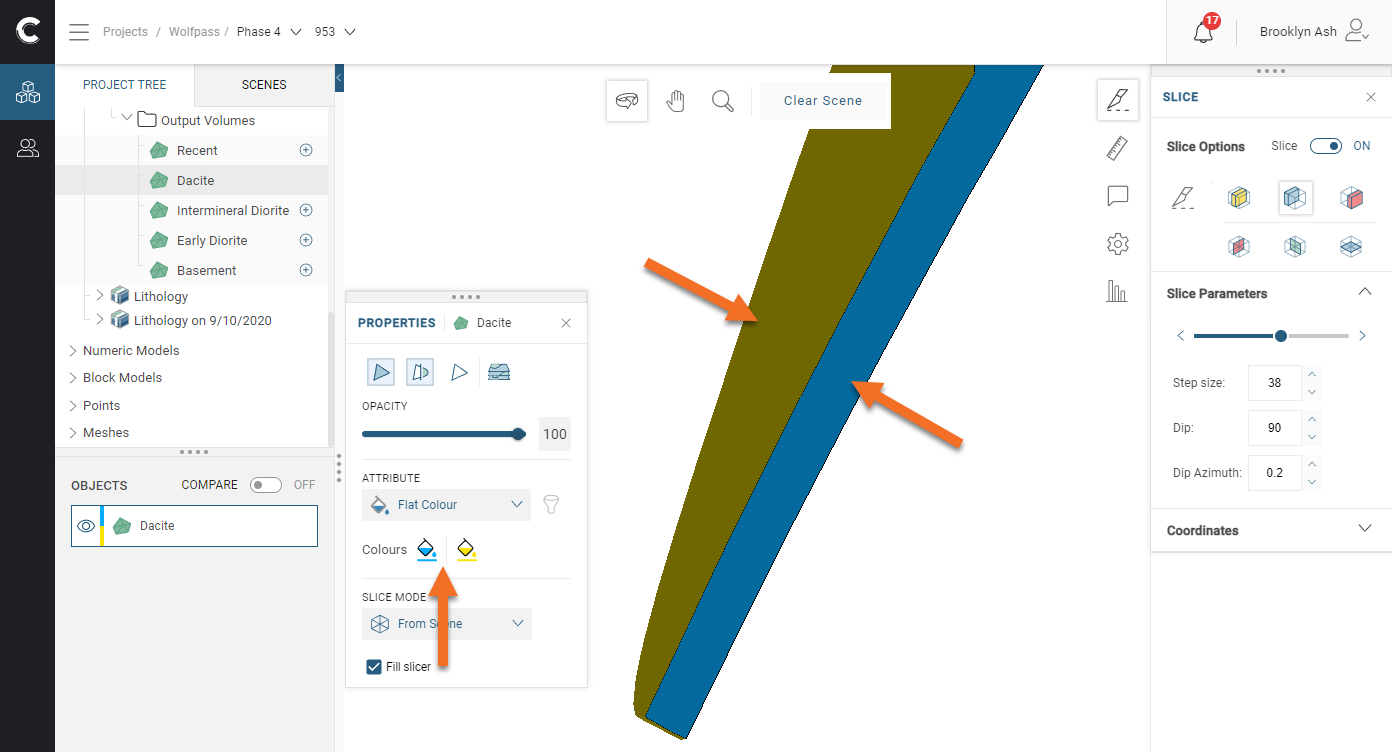
Here a vein contact surface is displayed sliced, showing the inside and outside of the vein, coloured blue and yellow respectively:
When a volume is displayed sliced, note that the volume can be displayed as a filled shape or an outlined shape. This is set using the Fill slicer option. In the example above, Fill slicer is enabled. Here, Fill slicer is disabled and so the interior of the dyke is visible:

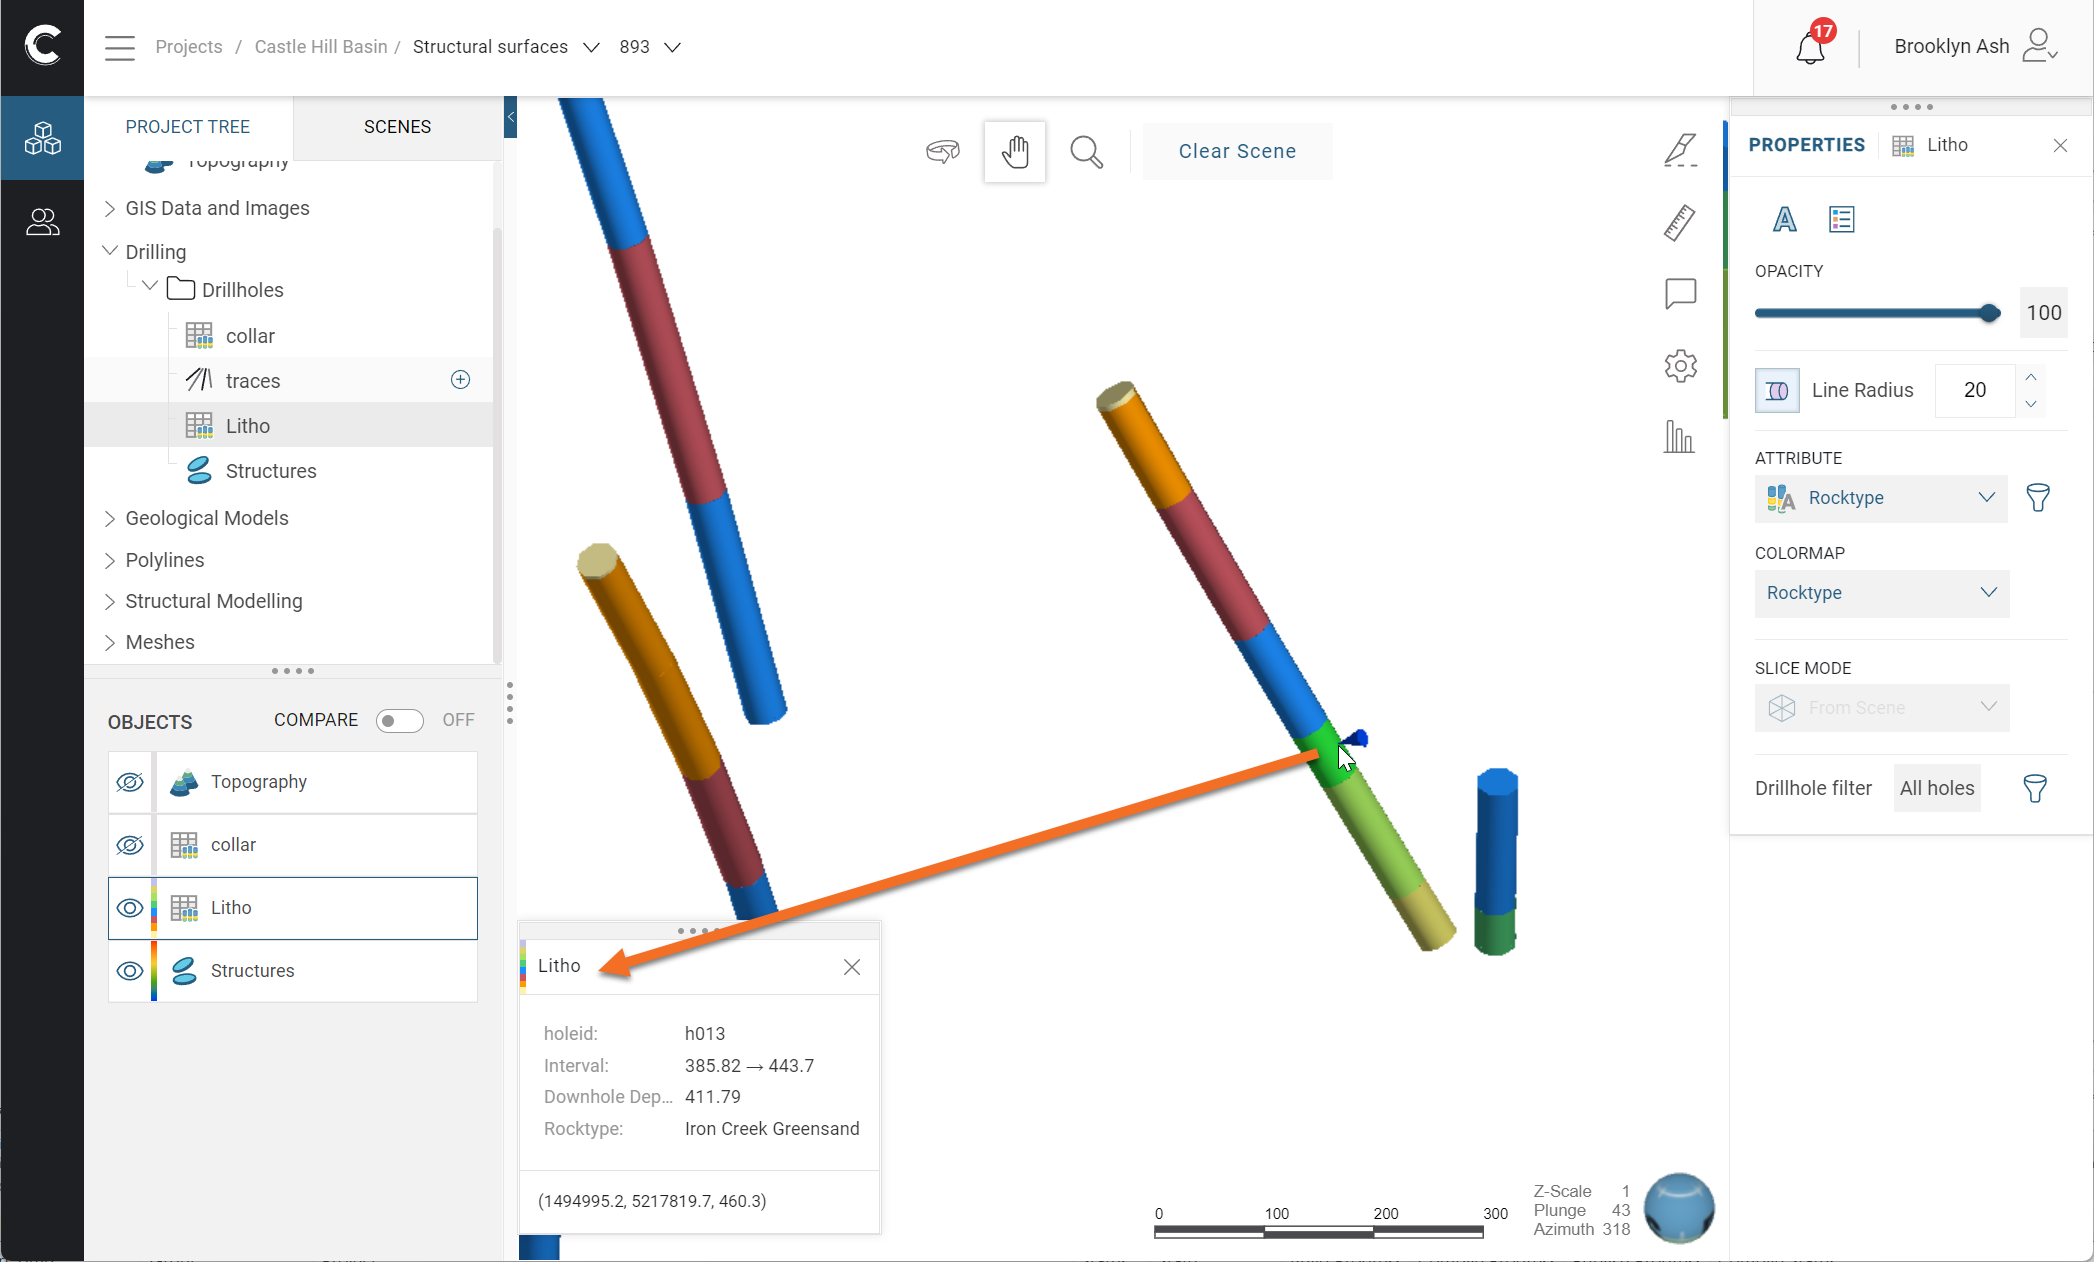
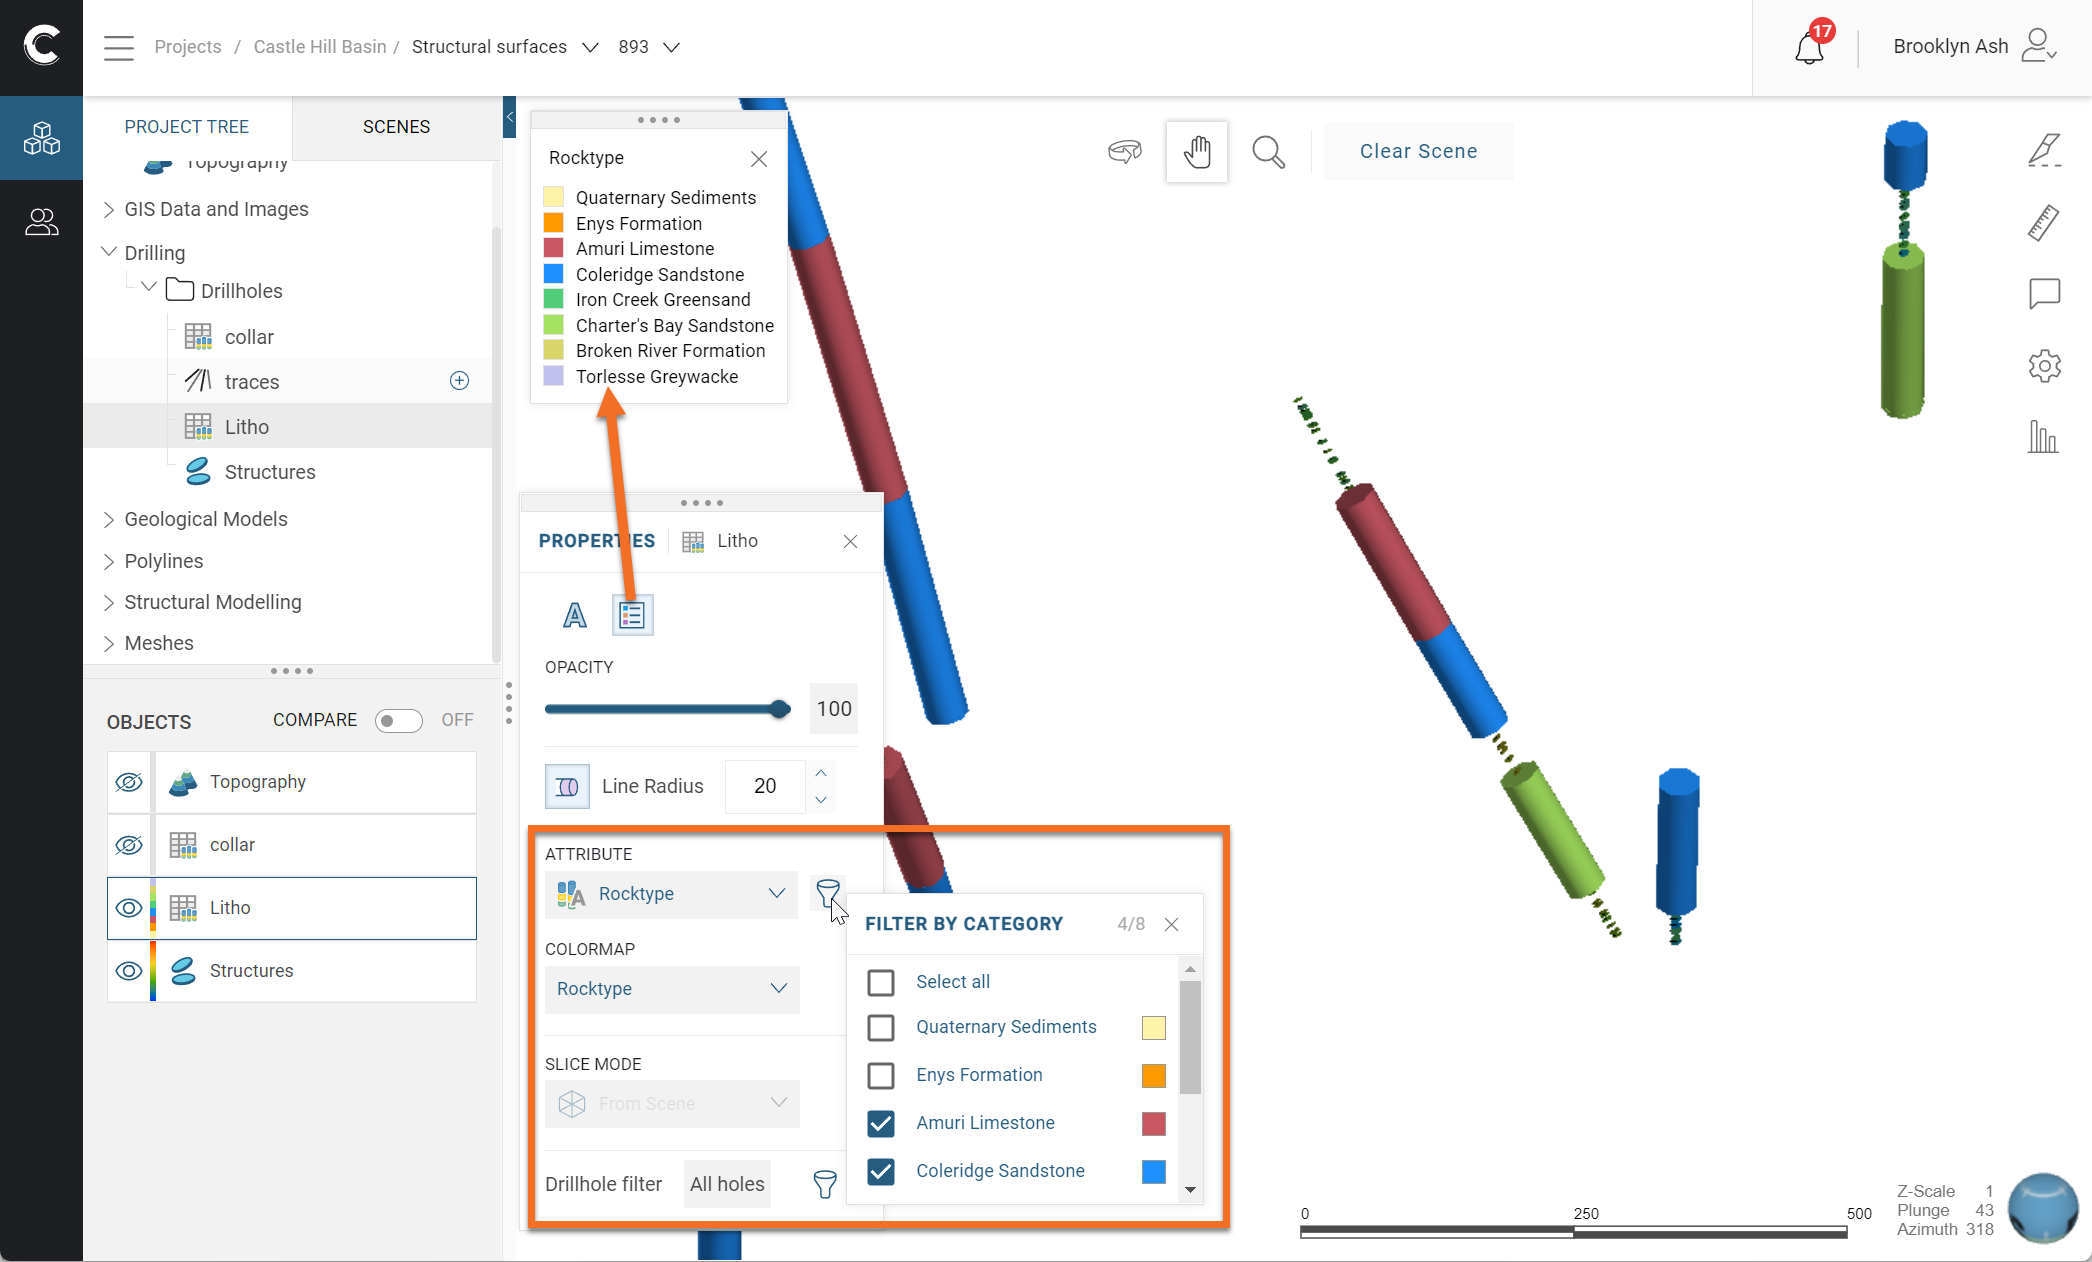
Data tables can be displayed using any of the available columns or by a flat colour. For example, here a lithology table is displayed. You can view data for an object by clicking on it in the scene:
To hide some or all of the categories, click on the Filter button (![]() ):
):
Displaying GIS Data
If a project has a topography surface, multiple GIS data objects and images in the project can be displayed draped on the topography. To do this, add the topography to the 3D scene. Click on it in the list to open its Properties panel, then click on the GIS data button (![]() ):
):
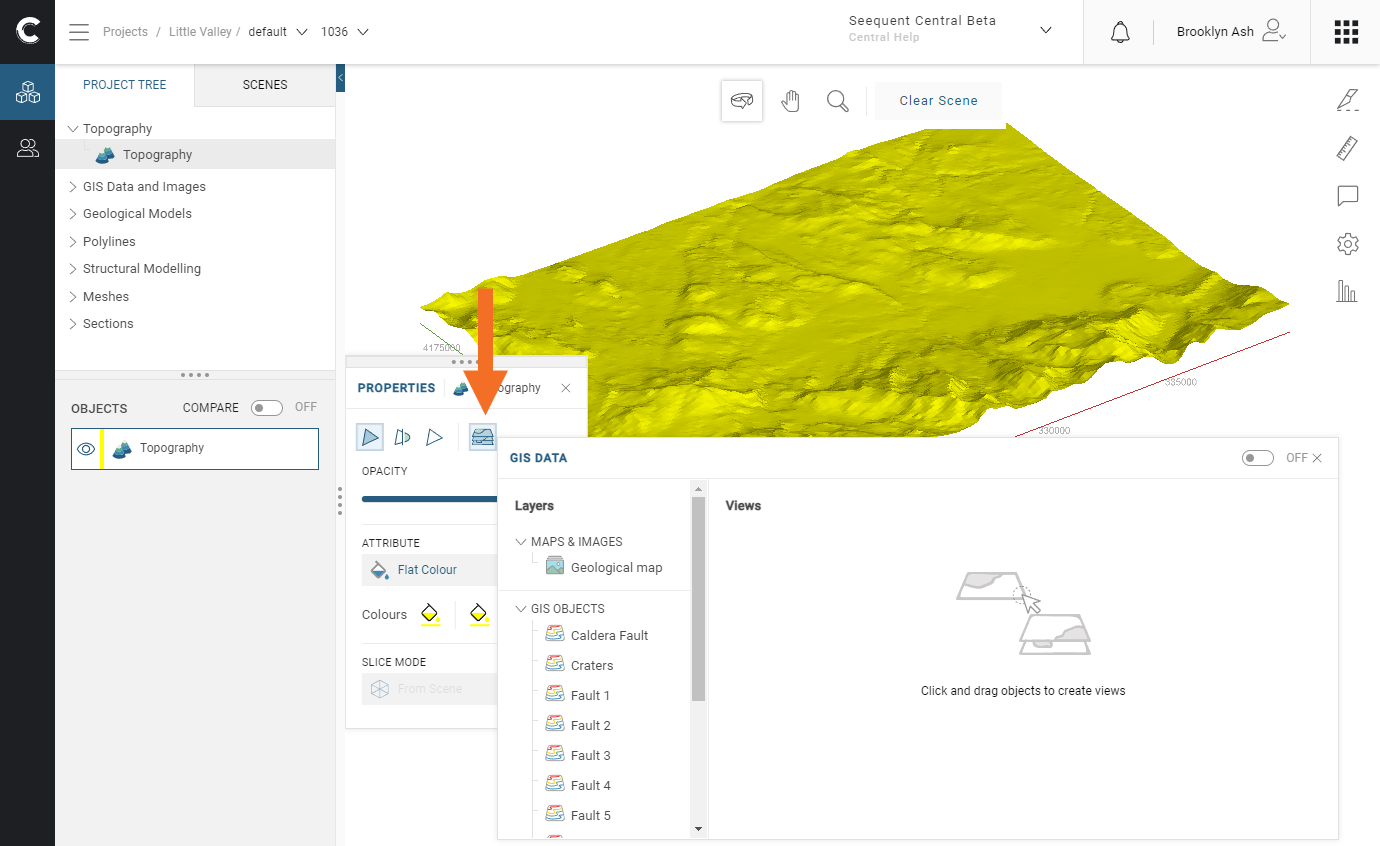
The GIS Data window shows the images and GIS objects in the project, which you can add to and reorder in the Views list:
Removing the topography from the scene will clear its GIS view settings. If you want to save a specific GIS data view, you can add a comment, and clicking on the thumbnail in the comment will restore the view:

Note that GIS data views cannot be included in saved scenes.
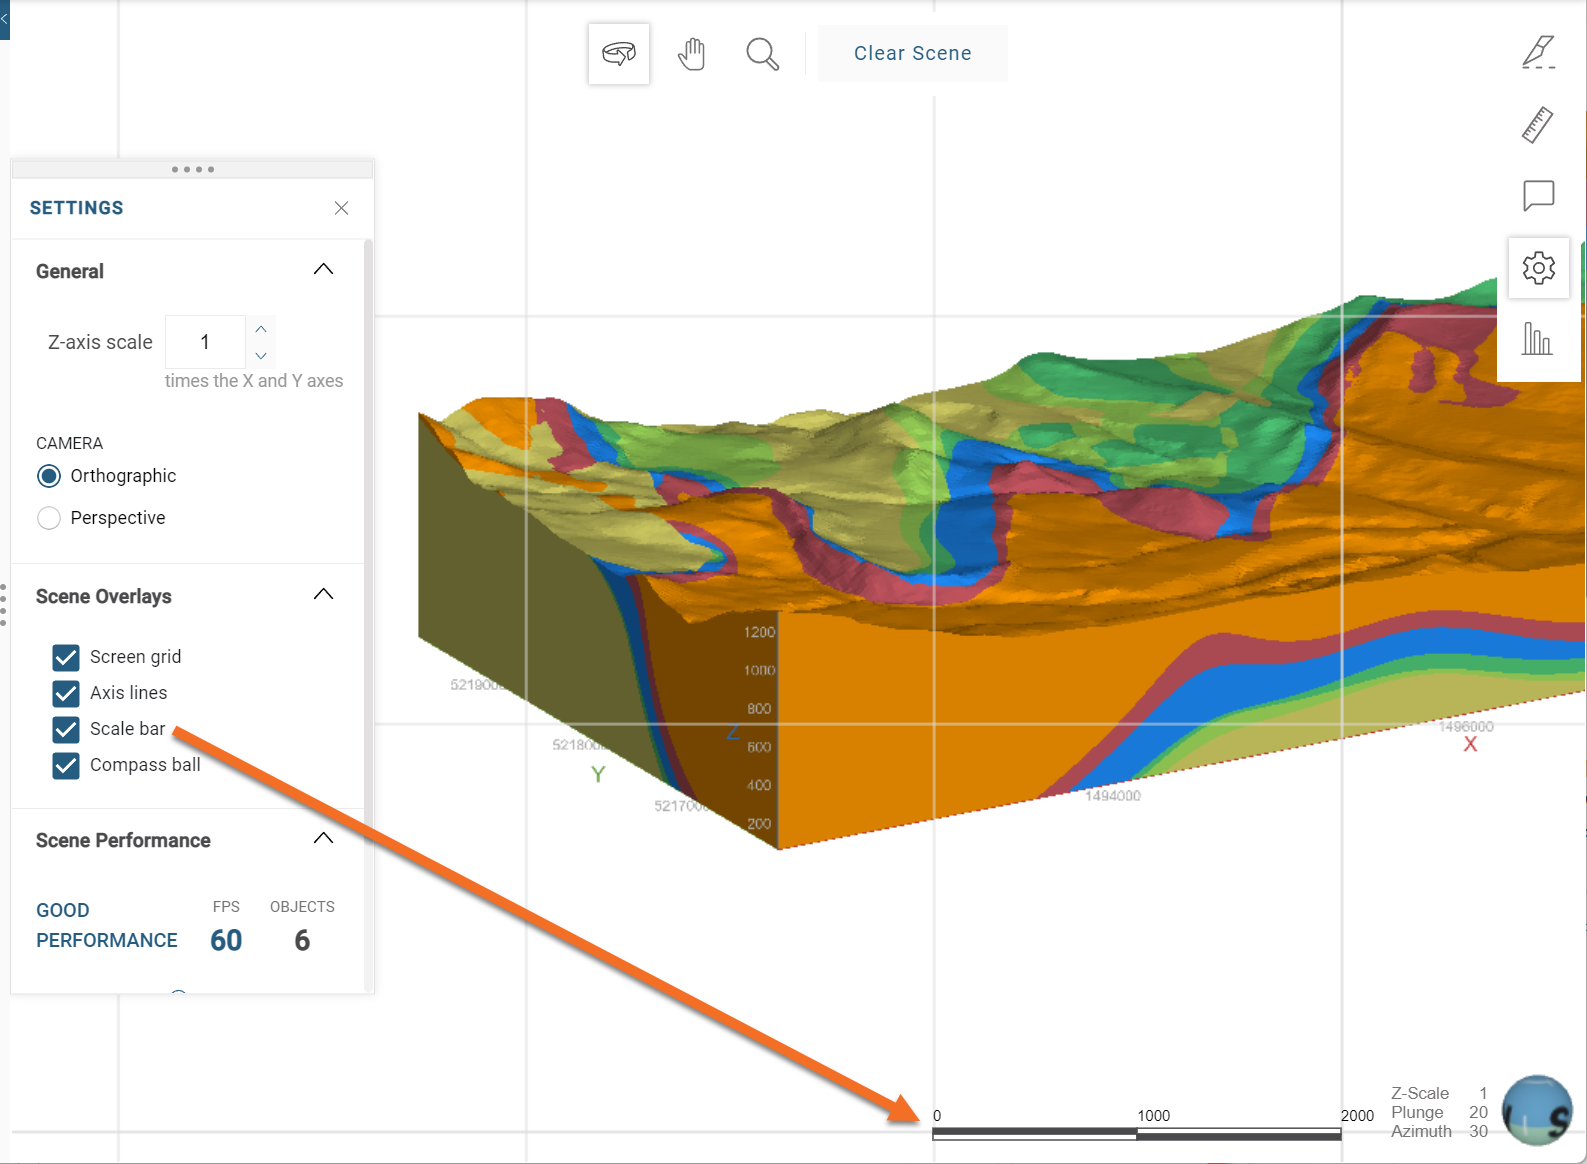
Changing 3D View Settings
Click the Settings button (![]() ) to open the Settings panel, which gives you options on how your scene is displayed:
) to open the Settings panel, which gives you options on how your scene is displayed:

The Z-axis scale setting lets you set a value greater than 1.0 for the z-axis relative to the x- and y-axes. This is useful when the area under study is very planar and extends over a wide area. In such cases, scaling the z-axis can accentuate the distribution of data along the z-axis.
This setting only applies to the project you’re currently working in and will be reset when you navigate away from the scene. If, however, you save a scene with a z-axis setting other than 1, it will be restored to the custom setting when you display the scene once again.
The Camera settings determine the projection used for rendering objects in the scene. Options are Orthographic and Perspective. Select the option you prefer.
There are four Scene Overlays you can include in your scenes:
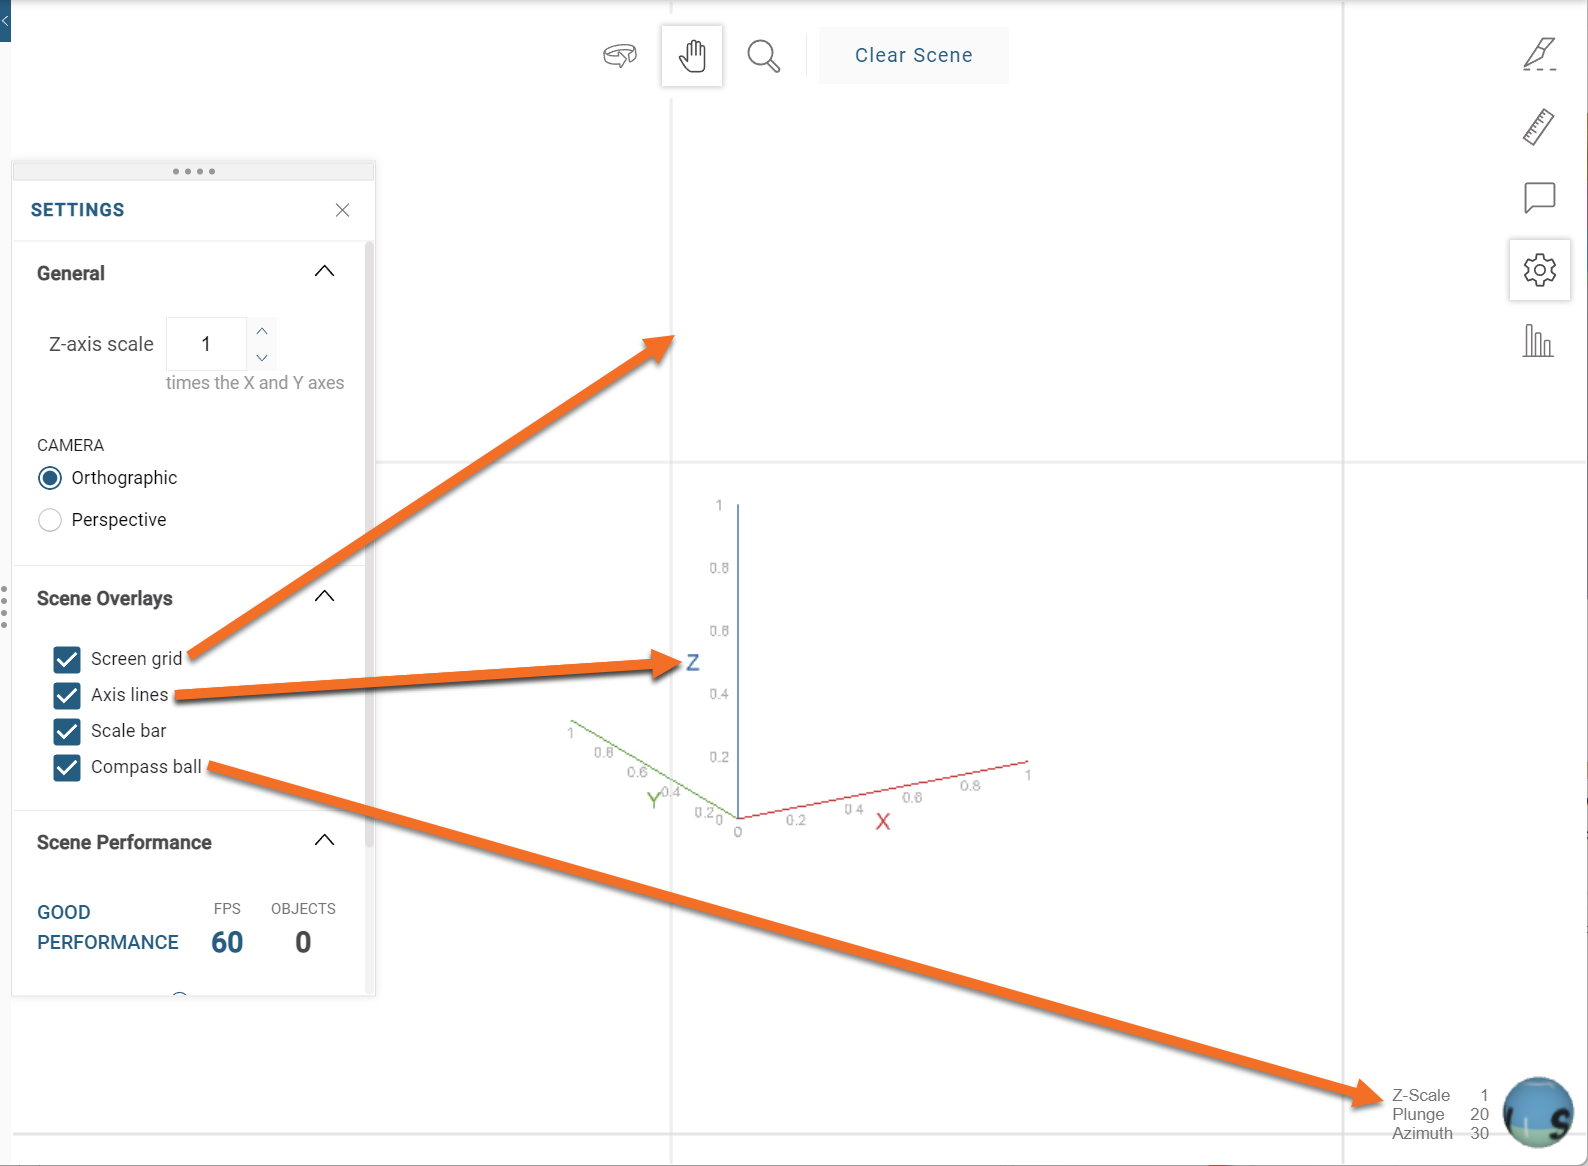
The effects of the Scale bar setting can only be seen when you have at least one object displayed:
Changes you make to these overlay settings apply generally to any project you view in the Central Portal. However, when you save a scene or make a comment, the screen overlay settings in place at the time are saved and will be displayed when you display the scene or comment.