
Creating charts
Once a report has been created, you can create a chart from the information in the report. You may wish, first, to reorder the columns, as described in Reorganising report columns in the Creating and generating reports topic.
Create a chart by selecting the columns you wish to include and then right-clicking on those columns. Select one of the chart types from the Chart Range menu:
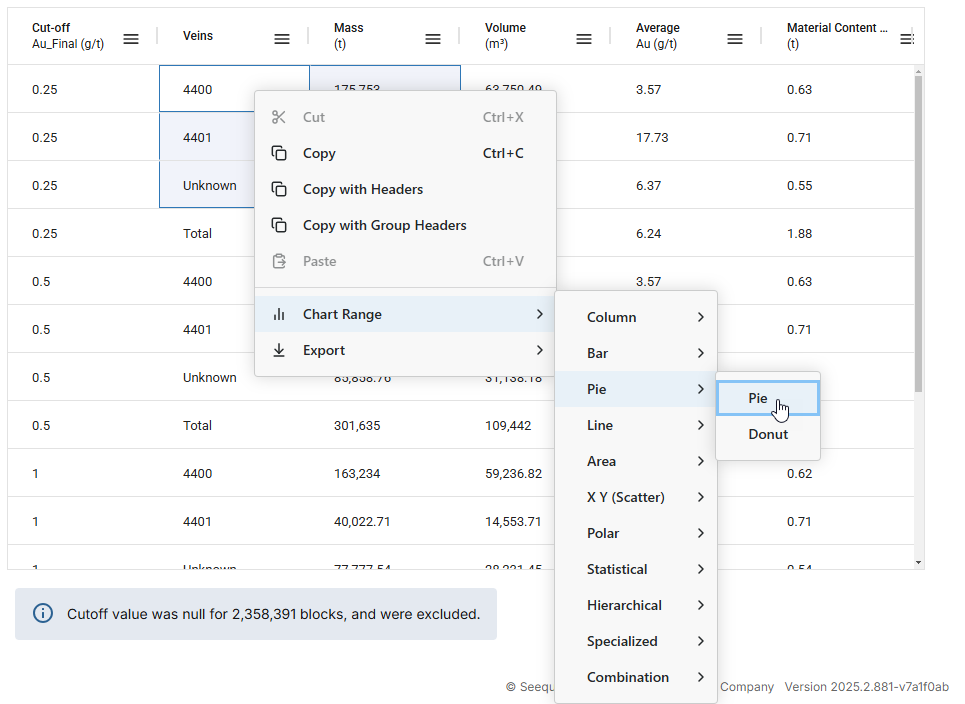
You can edit the chart once it has been created, so you will be able to experiment with the different settings available for each chart type.
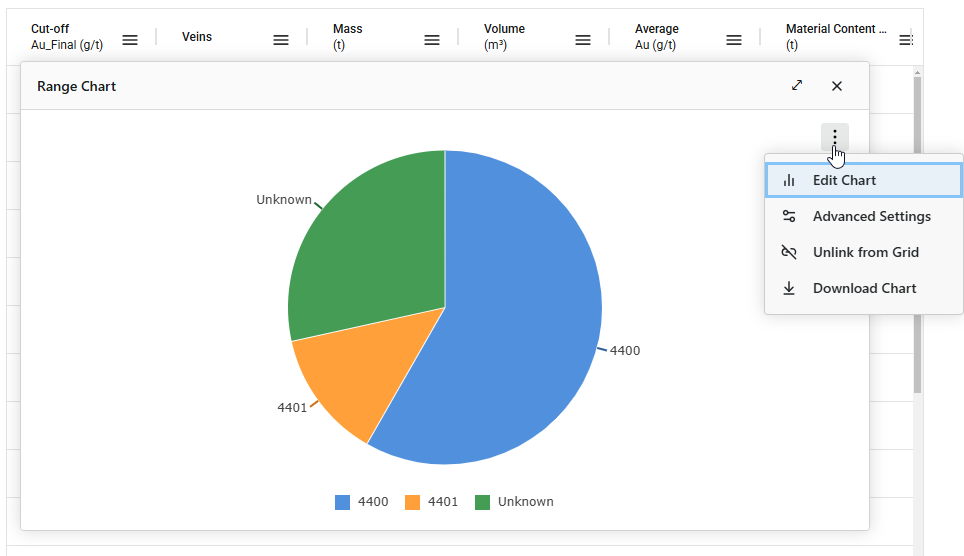
The chart will be generated and displayed in the browser window over the top of the data. You can move the chart within the browser window by clicking along the top of its window.
To edit the chart, click on its overflow menu (![]() ) and select Edit Chart:
) and select Edit Chart:
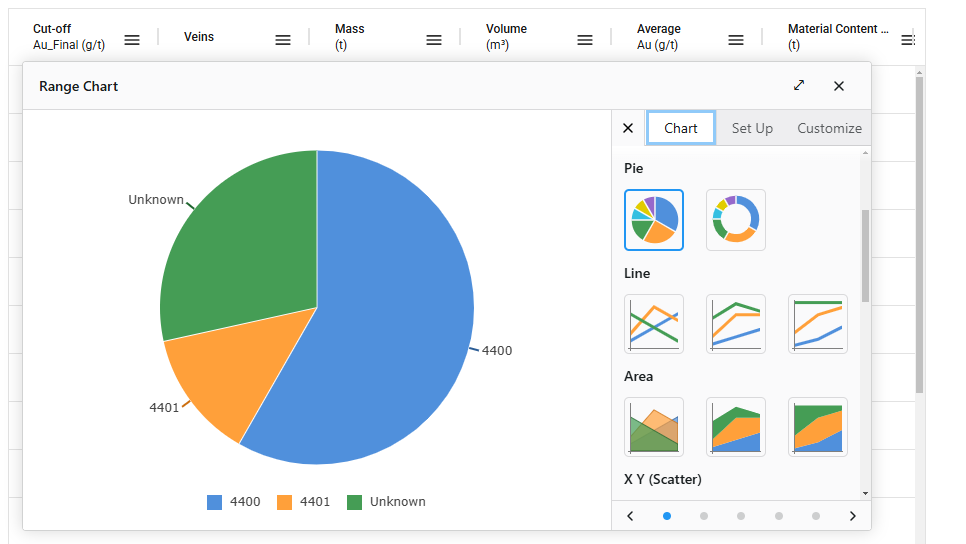
This opens a window that lets you choose a different chart type and customise various settings:
The arrows at the bottom of the Edit Chart window are for browsing through different colour options:
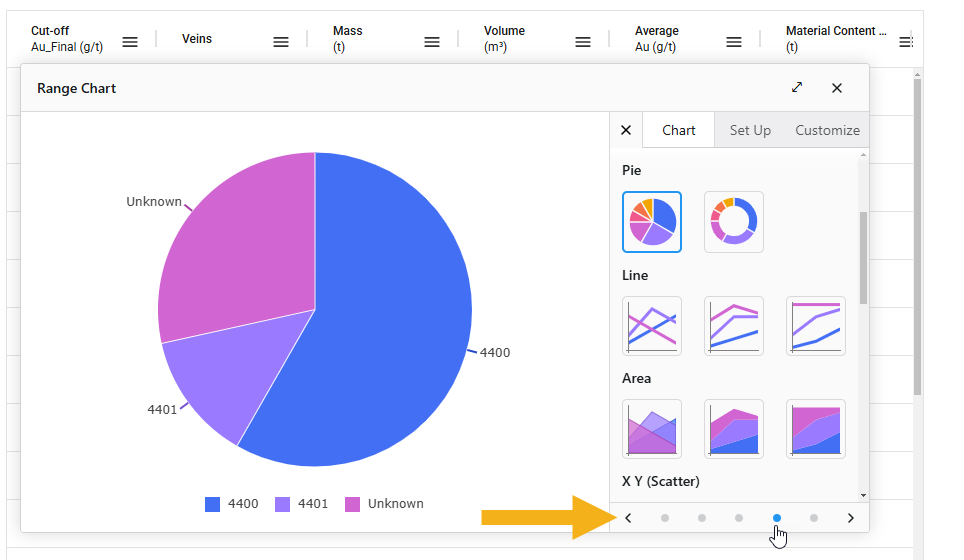
Changes you make in these settings are updated on the chart as you make them.
To save a copy of the chart, click on the chart’s overflow menu and select Download Chart. This saves the chart in *.png format in your browser’s download location.