
Preparing numeric drilling data for Driver
At a minimum, drilling data must be desurveyed before importing. Compositing the data and following the steps described in this topic are also recommended. For best results, ensure that your continuous numeric data is clean and validated prior to analysis in Driver. Analysis results may be surprising if missing data and errors are not handled carefully.
This topic describes strategies for preparing numeric drilling data for analysis in Driver. It is divided into:
- Data suitability
- Handling missing values and special characters
- Compositing data
- Considerations when using continuous attributes
- Handling category attributes
Data suitability
Driver’s anisotropy detection algorithms work best on data that contains information delineating inside values (continuity) and outside values. For this reason, it is often useful to replace implied outside values, e.g. missing data, with zeros. See Handling missing values and special characters later in this topic for more information on this.
The results of a Driver analysis will be more accurate if as much spatial information as possible is provided, including both inside and outside values. This is because the anisotropy detection algorithm works by utilising both the samples that are above a certain threshold and their spatial relationship to samples that are below a certain threshold.
Driver can handle datasets with up to three million sample points and will adapt to the density of input information, adjusting the scale and resolution of identified features accordingly. The best results will come from densely drilled information such as grade control datasets, but Driver will generally perform well on most advanced exploration datasets.
To illustrate, here we have three levels of coverage. Insufficient data (A) will deliver poor results, whereas moderate drilling coverage (B) can deliver good results. The best scenario (C) is a large amount of drilling data with good coverage.
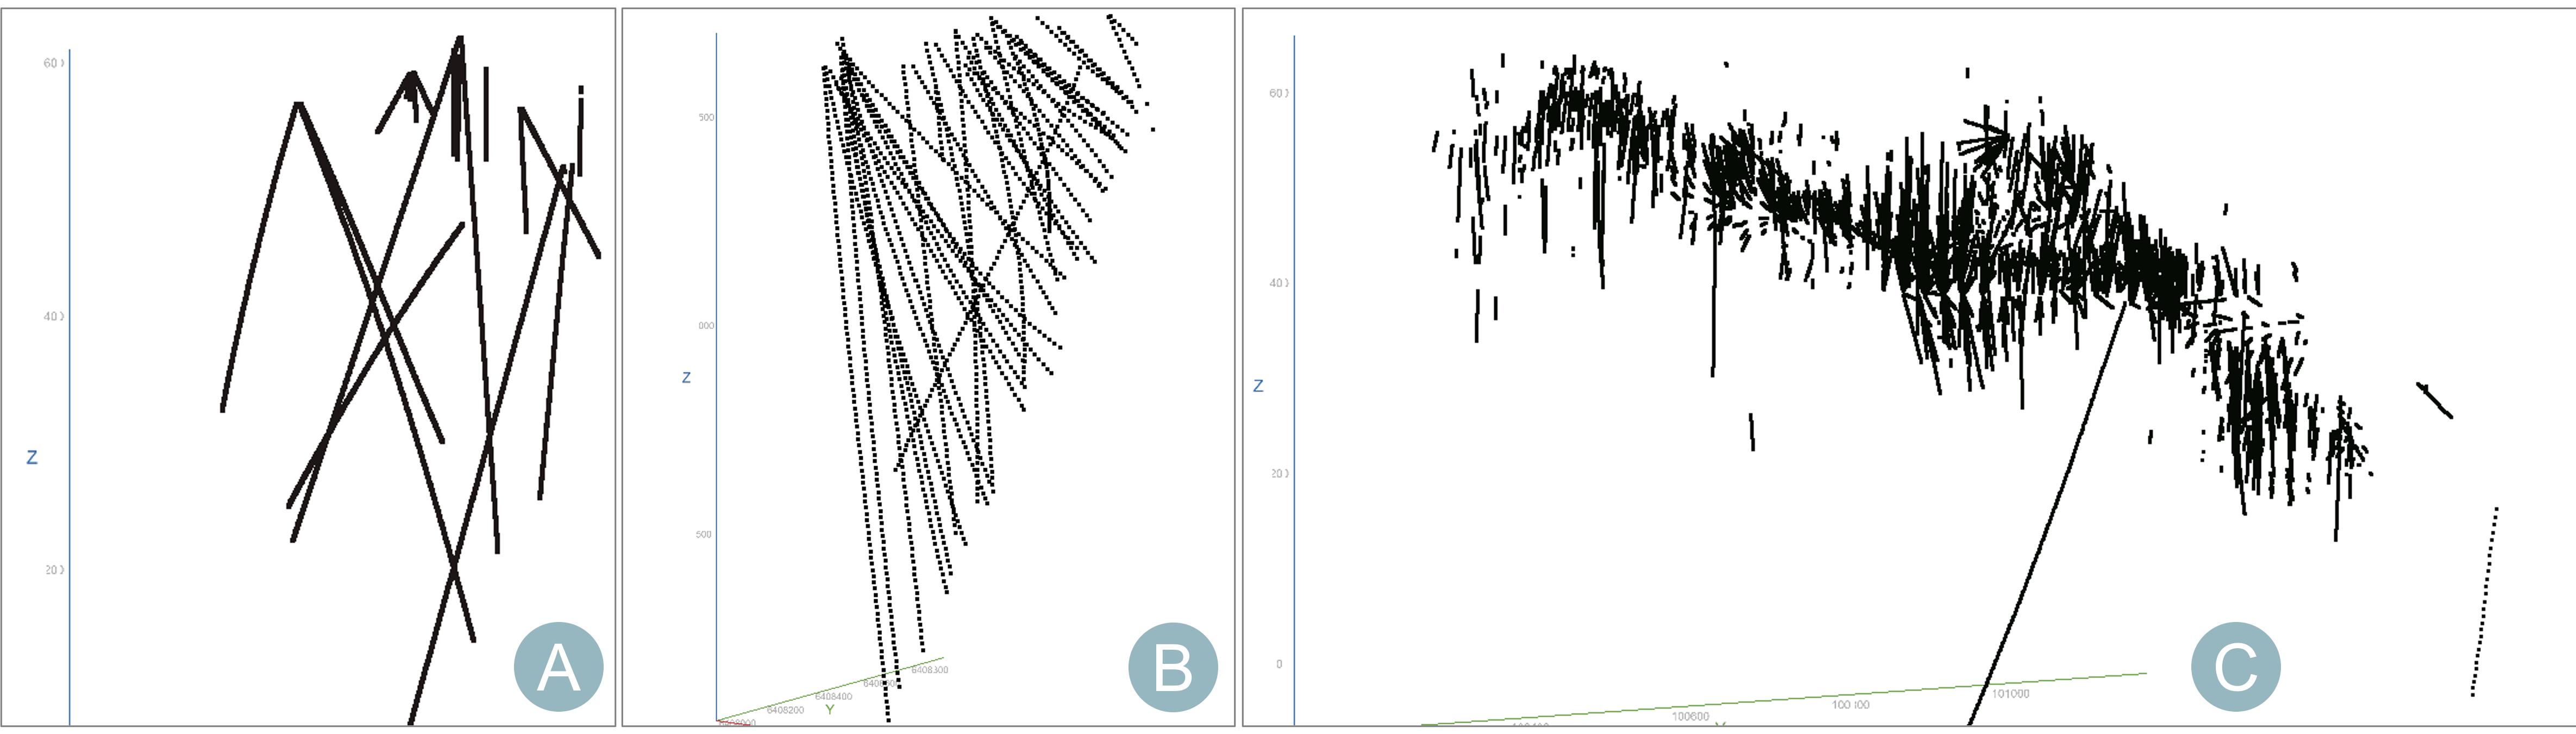
If the geological features of interest can be reasonably reconstructed from the provided 3D data coverage, then the analysis is typically good. However, if a feature such as a complex folded structure is only represented in a few drillholes, then the resulting analysis will be poor.
Handling missing values and special characters
Missing data or data that contains special characters is common when dealing with datasets accumulated through multiple generations of drilling. For example, drilling data may contain special characters representing grade values that are below a detection limit or missing values where core segments were lost or not sampled.
When drilling data is imported, Driver will clean the data to ignore text, special characters and not-a-number (NaN) replacement values. Absent data should be handled carefully to get the most from Driver. In some cases, missing data can be strategically replaced with zeros. In other cases, it may be appropriate to supply missing data for NaN or empty entries. However, in most situations filling missing values with zero is preferred.
When handling missing values, the following principles can be applied to your data prior to import into Driver:
- Decide if the missing value is an outside value. For example, perhaps assays were only performed on mineralised core or core that showed visible quartz veins. If data is missing due to this practice, replacing the missing values with zeros is recommended.
- Be aware that replacing missing values will affect data population properties such as the mean.
- Evaluate whether it is practical to include only the attribute of interest. Often a dataset may have a large number of samples with the commodity elements assayed, but only a handful of drillholes will have a complete multi-element suite. In many cases, it is best to drop these other attributes.
- If only a few samples are missing, they will not impact the results significantly.
- Explore some simple or advanced imputation techniques to fill in missing data.
- Do not replace the missing data with placeholders such as -999 or -99999.
Compositing data
Appropriate compositing can yield vastly superior outputs in Driver by removing high-frequency noise within the downhole assays and leaving behind the practically meaningful continuity trends. It is strongly recommended that data is numerically composited to a regular interval before use in Driver. Compositing is useful for removing noise and making the features as simple, obvious and consistent as possible. This could apply, for example, to vein thickness, a stratigraphic layer or an intrusion. A compromise will inevitably need to be made, because while smaller composite lengths are acceptable, the data will become noisier as a result.
Compositing also ensures that there is relatively even spatial support and that certain spatial regions do not adversely weight the orientation. For example, if there are many samples in a narrow band, compositing would ensure these samples do not overly influence the orientation.
- For narrow-vein systems choose a short composite length that doesn't overly dilute the interval grades.
- For larger-scale features, a larger composite length may be used.
A useful guideline is that a maximum composite length is about a third of the width of the smallest feature you want to extract. This ensures that there will be several samples inside the feature of interest and that each feature holds a strong signal for the algorithm to detect.
Considerations when using continuous attributes
Driver assumes that the features of interest will be delineated by elevated values, as opposed to depleted values. If your features are delineated by depletions, inverting the attribute of interest prior to use in Driver is recommended. In addition, upload the data as a separate attribute column during import.
Use caution when selecting a threshold. For computed variables, ratios or other non-standard continuous attributes, data properties such as the mean and median may not yield useful insights. See Creating a new anisotropy estimation for an explanation of the threshold parameter.
Handling category attributes
Driver does not evaluate category attributes so some data preparation is required before category data can be used. This should be done in your modelling software, such as Leapfrog Geo, prior to analysis in Driver.
First, assign each category to an individual attribute column. For example, if a category column has codes andesite and granite, assign a new column for andesite and a new column for granite.
Next, assign a binary value to every sample in the new columns, making samples inside the category as 1, and samples outside the category as 0.