
Displaying data
This topic describes the basics of displaying data in Driver. It is divided into:
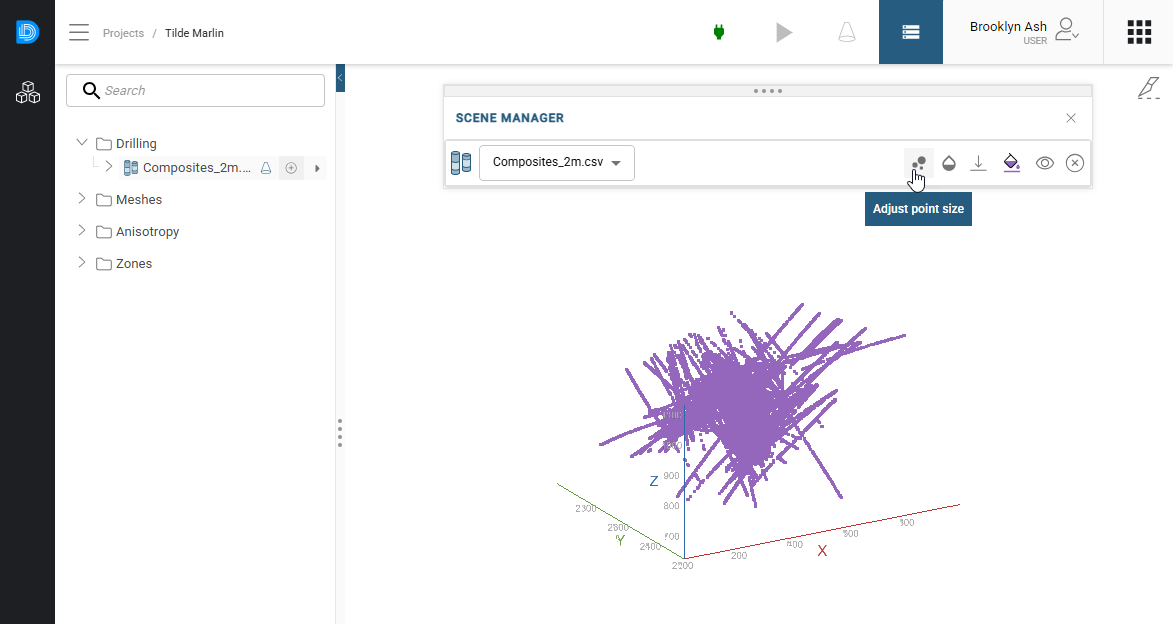
The scene manager
Add data to the scene by clicking on the Add button (![]() ) for an object or by dragging it into the scene. Doing so displays the object and opens the scene manager, which has controls for changing how the object is displayed. You can also download the data, if you wish to save a local copy.
) for an object or by dragging it into the scene. Doing so displays the object and opens the scene manager, which has controls for changing how the object is displayed. You can also download the data, if you wish to save a local copy.
Hold your mouse cursor over each option for more information:
Changing how you view objects in the scene manager does not change those objects in the project tree.
What options are available depend on the data type displayed, but controls common to most object types include:
- Changing the object’s opacity (
 )
) - Downloading the object (
 )
) - Changing the object’s colour (
 )
) - Hiding or showing the object (
 )
) - Removing the object from the scene (
 )
)
The spotlight tool
With the spotlight tool, you can examine the properties and metadata of an object in more detail. There are two ways to open the spotlight tool for an object:
- By clicking the spotlight button (
 ) for that object in the project tree (A)
 - By clicking on that object’s icon in the scene manager (B)
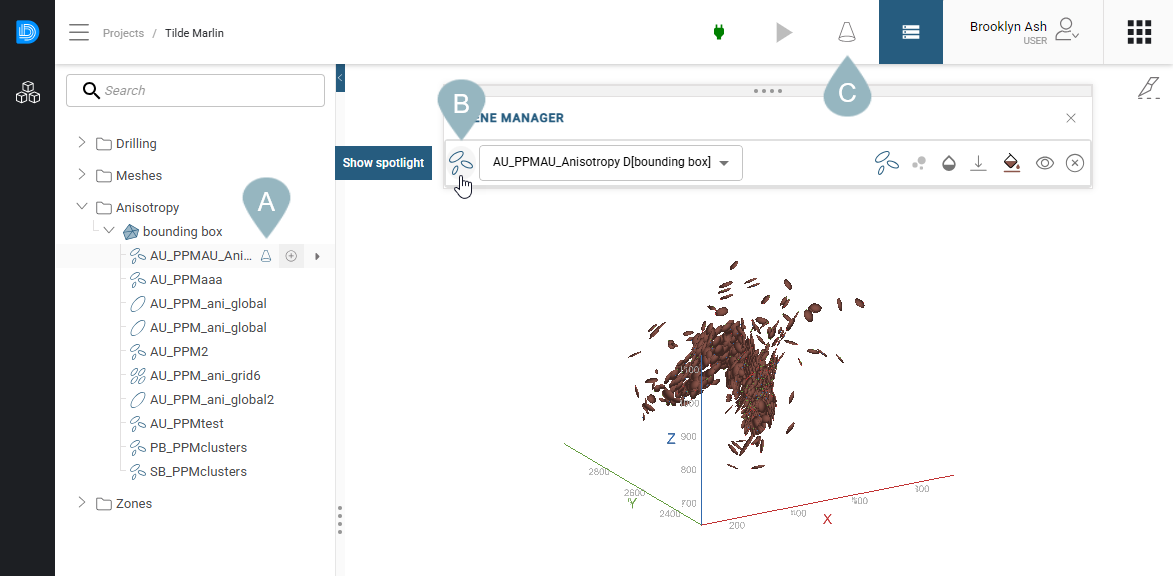
When the spotlight tool is open for an object, clicking the spotlight button (![]() ) in the toolbar above the scene window (C) will hide the spotlight window temporarily. Click the button again to reopen the spotlight window.
) in the toolbar above the scene window (C) will hide the spotlight window temporarily. Click the button again to reopen the spotlight window.
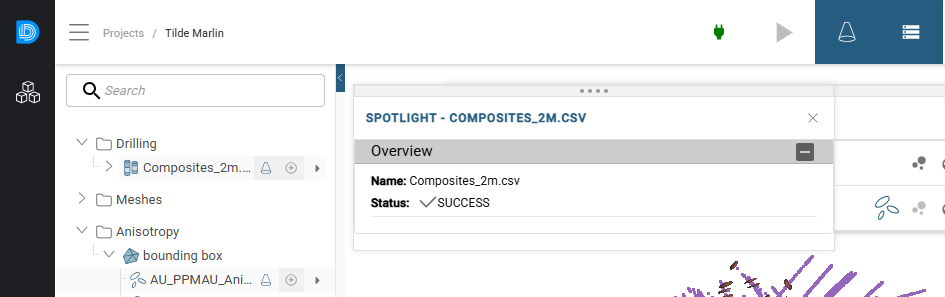
What is displayed in the spotlight tool depends on the object. In some cases, the information is basic, such as with this drilling data, where it is not possible to make changes to the data object:
In other cases, more analysis tools are available, which is the case here for an anisotropy estimation:
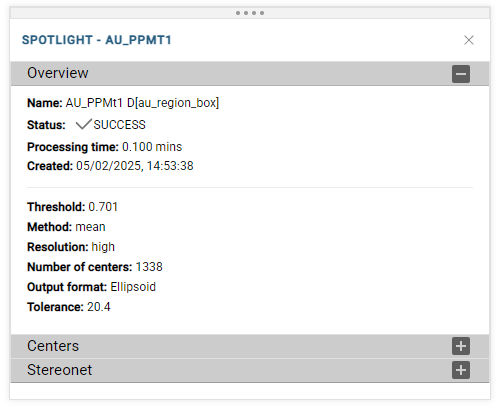
The Overview tab shows a summary of the anisotropy estimation.
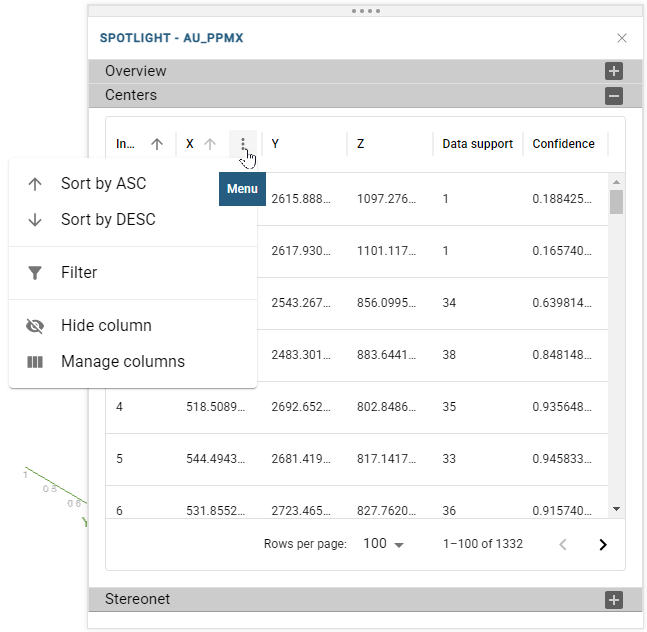
The Centers tab provides a table summary of each anisotropy analysis centre, including metrics such as local Data support and Confidence. You can adjust the column width, sort rows and there is an overflow menu for each column header displaying more options.
The Stereonet tab provides a useful way of summarising the structural features revealed by an anisotropy estimation.
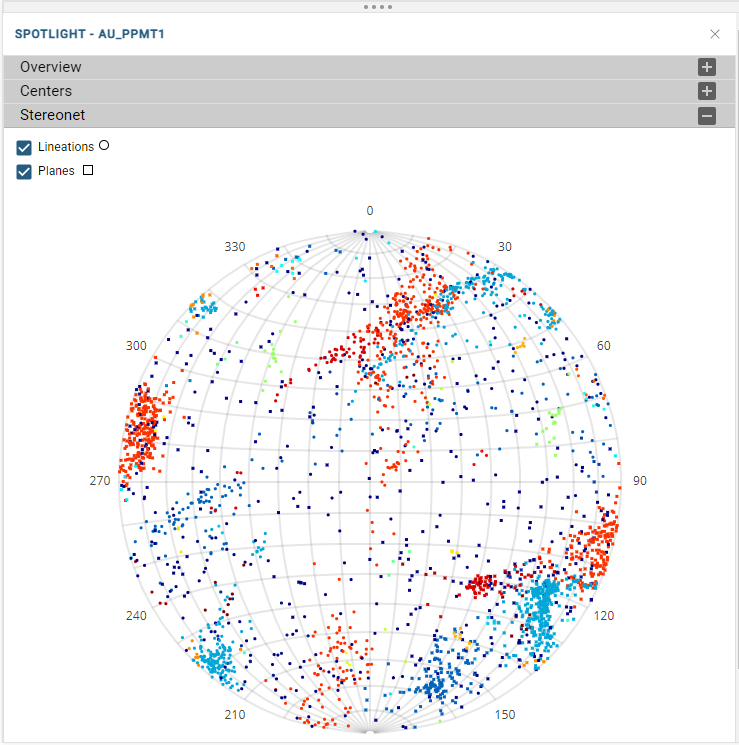
From this tab, you can control whether Lineations or Planes or both are displayed on the stereonet. The colourmap on the points is dynamically linked to the chosen display in the scene manager.
Drawing slices
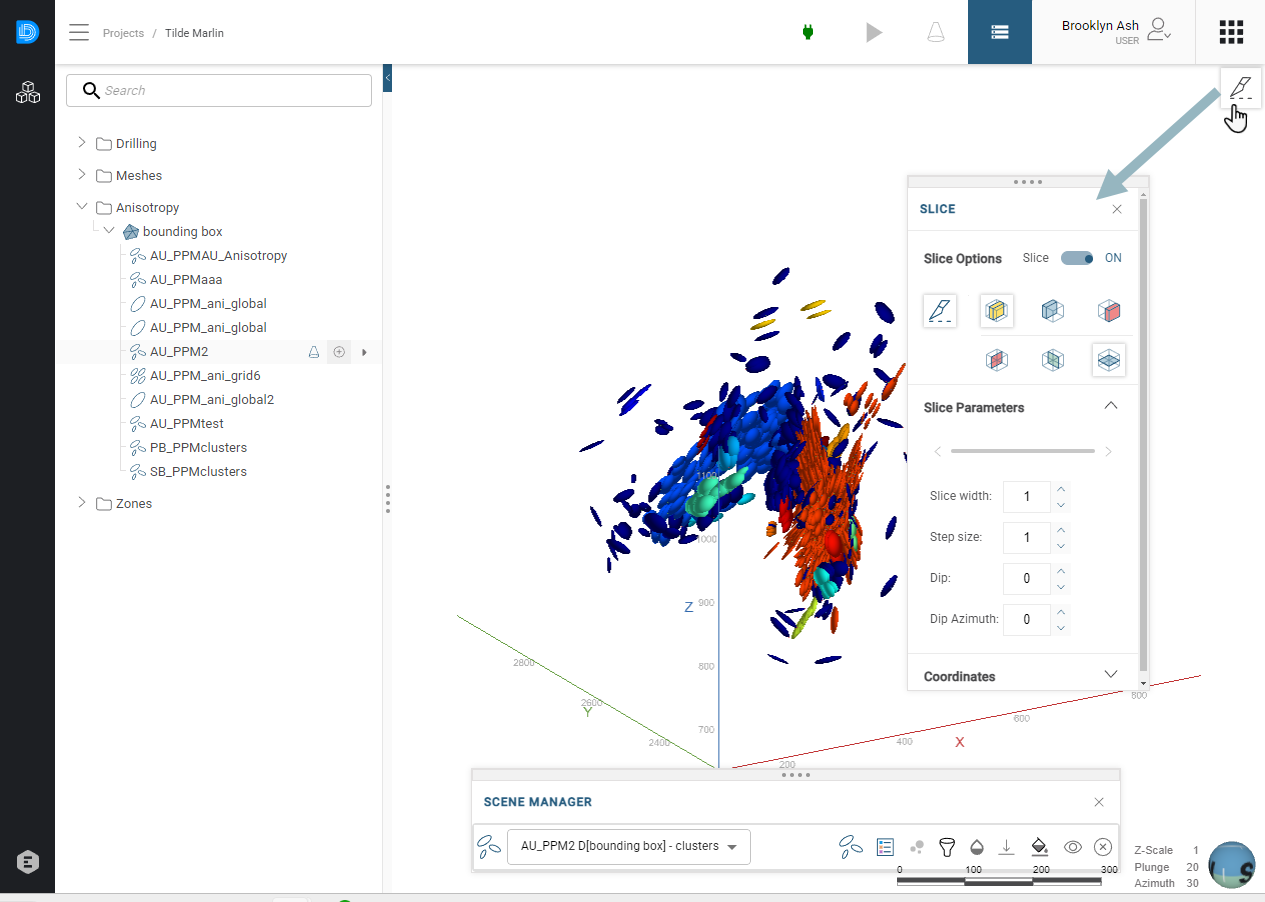
The Slice tool (![]() ) is used to cut cross-sectional views through data objects. This tool can be found in the top right-hand corner of the scene:
) is used to cut cross-sectional views through data objects. This tool can be found in the top right-hand corner of the scene:
Driver’s slice tool works in the same way as the Evo Viewer’s slice tool. See the Drawing slices topic in the 3D Viewer help.