
Drilling Data
Drilling data forms the basis for creating models in Leapfrog Geo. Import drilling data by right-clicking on the Drillhole Data folder and selecting one of the import options:
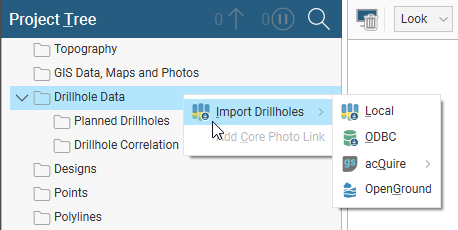
Each of these options is discussed in the Importing Drilling Data topic.
Because drilling data often contains errors that reduce the reliability of a model, Leapfrog Geo has tools that help you to identify and correct errors and work with the data. These tools are described in the Identifying and Correcting Data Errors in Leapfrog Geo topic.
Once imported and corrected, drilling data usually requires further processing before any models are built. Leapfrog Geo has a number of tools for processing drilling data; some of these options add new columns to existing tables and some create new tables.
Options that add new columns to existing tables are:
- Selecting Intervals. If the lithologies in a column are poorly sorted, you can display the column in the scene and use the interval selection tool to work with all the segments and sort them into new units.
- Splitting Lithologies. With the split lithologies tool, you can create new lithologies from lithologies in an existing lithology column by selecting from intervals displayed in the scene.
- Grouping Lithologies. The group lithologies tool lets you define a new unit to which existing units are added. For example, a sandstone deposit might appear in an interval table as poorly-sorted and well-sorted units. The group lithologies tool lets you group both units into a single sandstone unit.
- Overlaid Lithology Column. You may have two versions of an interval column, one that contains draft data and one that contains the final version. The final version may contain gaps, which can be filled in using the draft version. The overlaid lithology tool lets you combine the two columns to create a new column.
- Category Column From Numeric Data. When you have numeric data you wish to use with the lithology and category modelling tools, you can convert the numeric data to a category column.
-
Evaluated Columns. An evaluated column adds data to a table from another source within the project, often integrating some information generated from your analysis activities back onto some source data tables (back-flagging).
- Majority Category From Other Table. When you have category data such as economic compositing status or lithology data from another table, you can back-flag it onto an interval table.
Options that create new tables are:
- Category Composites. Sometimes unit boundaries are poorly defined, with fragments of other lithologies within the lithology of interest. This can result in very small segments near the edges of the lithology of interest. Modelling the fine detail is not always necessary, and so compositing can be used to smooth these boundaries.
- Economic Composites. Economic compositing classifies assay data into “ore” and “waste” categories, taking into account grade thresholds, mining dimensions and allowable internal dilution. The result is an interval table with a column of ore/waste category data and a column of composited interval values, plus some additional columns showing the length, linear grade, included dilution length and included dilution grade.
- Majority Composites. Category data can be composited into interval lengths from another table or into fixed interval lengths. The compositing is based on a majority percentage where each interval is assigned a category based on the category that makes up the highest percentage of the new interval.
- Numeric Composites. Compositing numeric data takes unevenly-spaced drilling data and turns it into regularly-spaced data, which is then interpolated. Numeric data can be composited along the entire drillhole or in selected regions. You can also set the compositing length from the base interval table.
- Back-Flagging Drilling Data. Evaluating geological models on drillholes creates a new lithology table containing the lithologies from the selected model.
- Merging Drilling Data Tables. If you are working with columns in different interval tables in the same drilling data set, you can create a new merged table that includes columns from these different tables. Columns created in Leapfrog Geo can be included in a merged table.
Finally, when you have data across multiple drilling data sets that you wish to use elsewhere in the project, you can create a combined drilling data set that contains interval values, downhole points, downhole structural data and screens data from other drilling data sets. See Combining Drilling Data Sets.
The rest of this topic discusses:
- How Drilling Data is Organised in Leapfrog Geo
- Viewing Drilling Data Table Statistics
- Exporting Drilling Data
- Exporting Drillhole Traces
See the separate Displaying Drilling Data topic for information on the different ways of displaying drilling data in the scene.
How Drilling Data is Organised in Leapfrog Geo
In Leapfrog Geo, drilling data is organised into drilling data sets, which are made up of a collar file, a survey file and at least one interval table. A drilling data set can also contain:
- Downhole points
- LAS points
- Downhole planar structural data
- A screens table, if you have the Hydrogeology extension
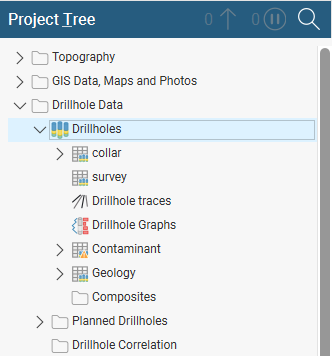
Here, a single drilling data set made up of a number of tables has been added to the project, stored in the Drillhole Data folder:
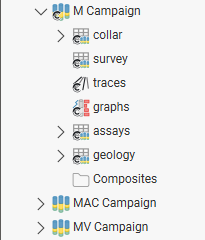
Here there are three drilling data sets, M Campaign, MAC Campaign and MV Campaign:
You can open each table (![]() ) in a drilling data set by double-clicking on it. The table will be displayed and you can make changes in it, as described in the Working With Data Tables topic. When there are errors in the data, the relevant table will be marked with a red exclamation mark (
) in a drilling data set by double-clicking on it. The table will be displayed and you can make changes in it, as described in the Working With Data Tables topic. When there are errors in the data, the relevant table will be marked with a red exclamation mark (![]() ). See Correcting Data Errors in Leapfrog Geo for more information on fixing drilling data errors.
). See Correcting Data Errors in Leapfrog Geo for more information on fixing drilling data errors.
In addition to the imported tables, each drilling data set has two objects that help in visualising and analysing the data. These are:
- The traces object. See Displaying Drillhole Traces.
- The graphs object. See Displaying Drillhole Graphs.
Individual drilling data tables can be deleted, as described in the Working With Data Tables topic. However, the collar table is referred to by all other tables in a drilling data set and so deleting the collar table will also delete those dependent tables.
Viewing Drilling Data Table Statistics
To view statistics on an interval table, right-click on the table in the project tree and select Statistics. The following options are available:
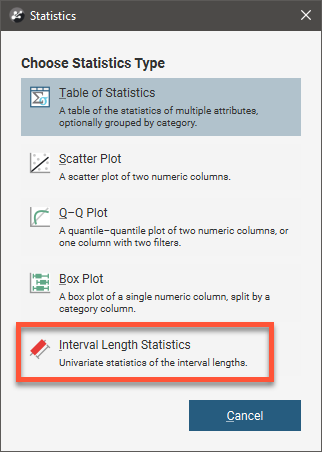
See the Statistics topic for more information on each option:
The Interval Length Statistics graph is a univariate graph, so for more information on the options available, see Univariate Graphs in the Statistics topic.
Right-click on a numeric column and select Statistics to open a univariate graph for that column.
Exporting Drilling Data
Changes made to the drilling data in Leapfrog Geo only affect the Leapfrog Geo database, not the original data files. You can export Leapfrog Geo drilling data, which is useful if you wish to keep a copy of drilling data outside the project.
You can:
- Export all data in a drilling data set. See Exporting All Drilling Data.
- Export only a single data table. See Exporting a Single Drilling Data Table.
These export options export the drilling data tables using To and From values to indicate location information. If you wish to export data with X-Y-Z values, extract points data using one of the following options:
- Extracting Contact Points from Drilling Data
- Extracting Intrusion Values from Drilling Data
- Extracting Interval Midpoints from Drilling Data
Then export the data object as described in Exporting Points Data.
If you need to export information on the geometry of drillholes without including the drilling data tables, you can export the drillhole traces as a polyline. See Exporting Drillhole Traces.
Exporting All Drilling Data
To export all drilling data in a drilling data set, right-click on the data set and select Export. The Export Drillhole Data window will appear:
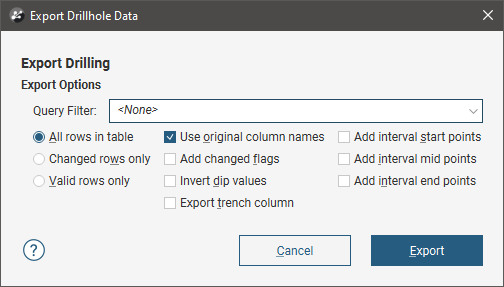
You can select whether the exported files includes all rows, only changed rows or only valid rows. You can also apply a query filter, if any have been defined for the drilling data set.
Once you have selected how you wish to export the data, click OK. The Export Drillhole Data Files window will appear:
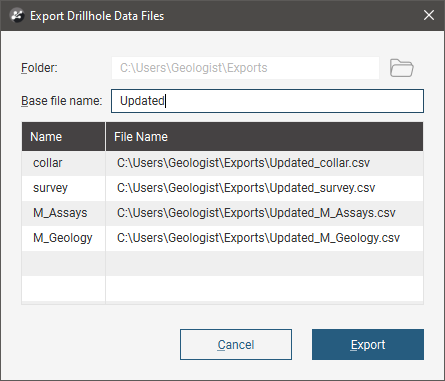
The list shows the files that will be created, one for each data table. Choose the Folder where the files will be saved, then enter a Base file name, which will be added to the front of each file name. However, a Base file name is not required.
Click Export to save the files.
Exporting a Single Drilling Data Table
To export a single drilling data table from a drilling data set, right-click on that table and select Export. The Export Drillhole Data window will appear:
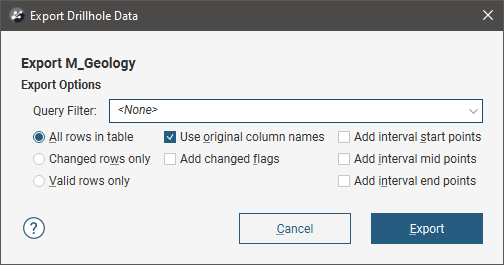
You can select whether the exported file includes all rows, only changed rows or only valid rows. You can also apply a query filter, if any have been defined for the drilling data set.
Once you have selected how you wish to export the data, click OK. You will be prompted for a filename and location.
Exporting Drillhole Traces
If you need to export information on the geometry of drillholes without including the drilling data tables, you can export the drillhole traces as a polyline. Formats supported are:
- Drawing Interchange Polyline Files (*.dxf)
- AutoCAD Drawing Files (2013/LT2013) (*.dwg)
- Bentley Drawing Files (v8) (*.dgn)
To export drillhole traces as a polyline, right-click on the traces object in the project tree and select Export As Polyline. In the window that appears, you can choose which drillholes to include:
- None. All drillholes in the drilling data set will be included.
- Selection. Choose from the list of drillholes in the drilling data set.
- Query filter. Choose one of the query filters that has been defined for the drilling data set.
Navigate to where you want to save the file, then click Save.