What’s New in Leapfrog Geothermal 3.7
New features and enhancements in Leapfrog Geothermal version 3.7 are:
- Downhole Well Graphs
- TETRAD Grid Coordinate Transform
- TOUGH2 Combined Models
- Split Views
- Render Individual or Mosaic Views
- Generate Intervals for Discrete Colourmaps
- Colour Gradient Options
- Add X = Y Line to Scatter Plot
- Extract Volume Surfaces
- Improved Line Symbology in Cross Section Layouts
- Improved Set Elevation Tool
- Connectivity Via Proxy
- Block Model Export to Surpac
See Updates to Previous Versions for information on changes to earlier versions of Leapfrog Geothermal.
Downhole Well Graphs
Geophysics or other downhole numeric data can now be displayed in the 3D scene to quickly visualise your well data in 3D as a trace line or bar graph.
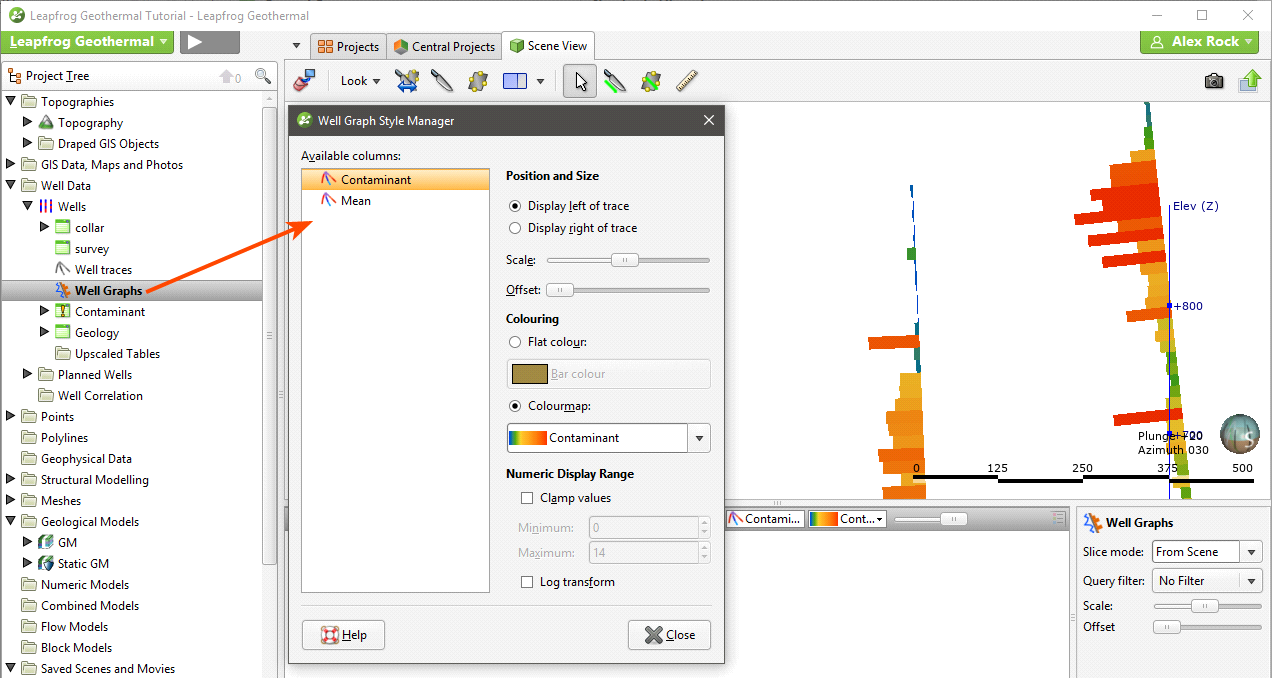
Interval numeric data is displayed as a bar graph, either with a single flat colour or using a colourmap. Minimum and maximum clapping values can be set, with the option to log transform the data. Scaling and offset slider bar controls help make the bar graph more viewable in the scene.
See Displaying Well Graphs for more information.
TETRAD Grid Coordinate Transform
When TETRAD grids are imported into Leapfrog Geothermal, they can either be in different coordinate systems, different locations and the X and Y axes can be on the wrong side with respect to the Z axis. This work gives users the ability to change the location and orientation of TETRAD grids. Users can also flip the Y axis, if required. These actions can be carried out when a grid is being imported and on grids that have been imported in previous versions of Leapfrog Geothermal.
See Importing a TETRAD Model for more information.
TOUGH2 Combined Models
A combined model can now be used to define the gridding of both structured and unstructured TOUGH2 models and for generating rocktypes. Combined models that can be used as the basis for a TOUGH2 grid must have only one geological model as part of the combined model. When that geological model is a faulted model, its faults will be used as inputs to the fault rock evaluation and as features on an unstructured grid.
Combined models made up only of numeric models cannot be used to define a TOUGH2 model’s gridding and generate rocktypes.
See TOUGH2 Models.
Split Views
The new split views feature displays the 3D scene from 1, 2 or even 3 additional viewing angles and assists with 3D spatial awareness. For even richer project engagement open a New Split View Tab and drag and drop onto a second monitor.
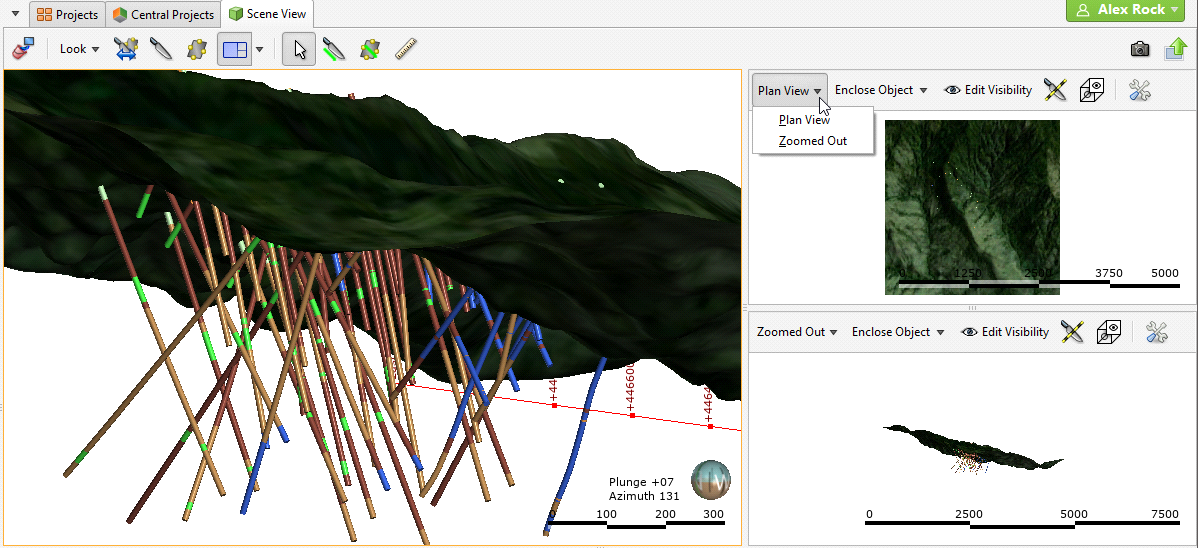
See Working With Split Views for full details.
Render Individual or Mosaic Views
Additional views can be rendered as images either individually or as a group.
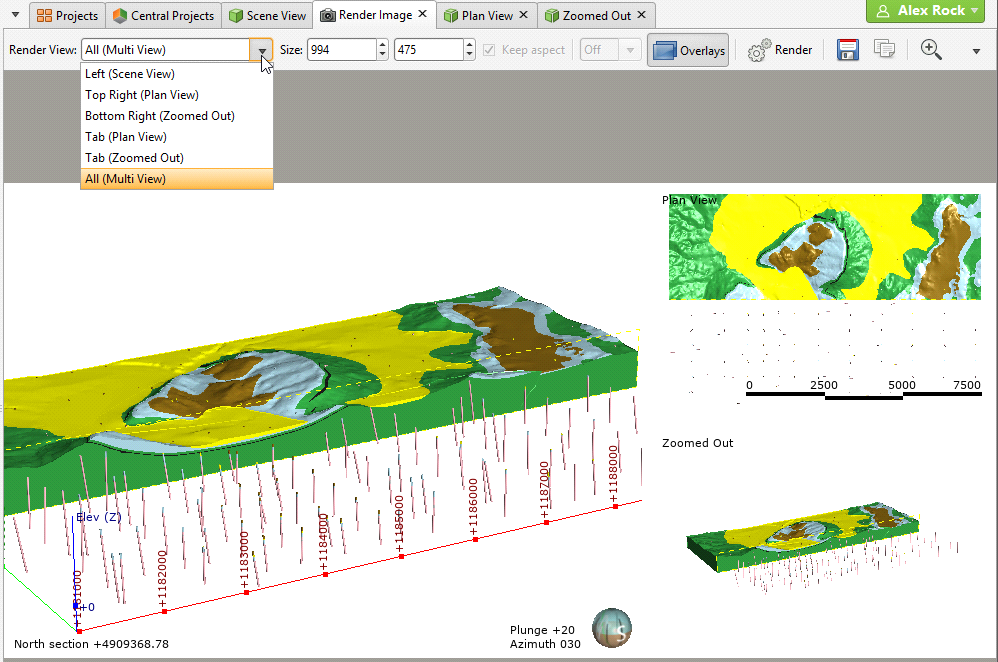
See Rendered Images for more information.
Generate Intervals for Discrete Colourmaps
A new option for discrete colourmaps allows for the quick generation of intervals based on the distribution of data values. The options are: Quantile, Progressive, Progressive Double, Equal Intervals, and K-Means Clustering. Applying a colour gradient auto-colours the intervals, while the discrete colourmap dialog now includes a column depicting the percentage of values in each interval.
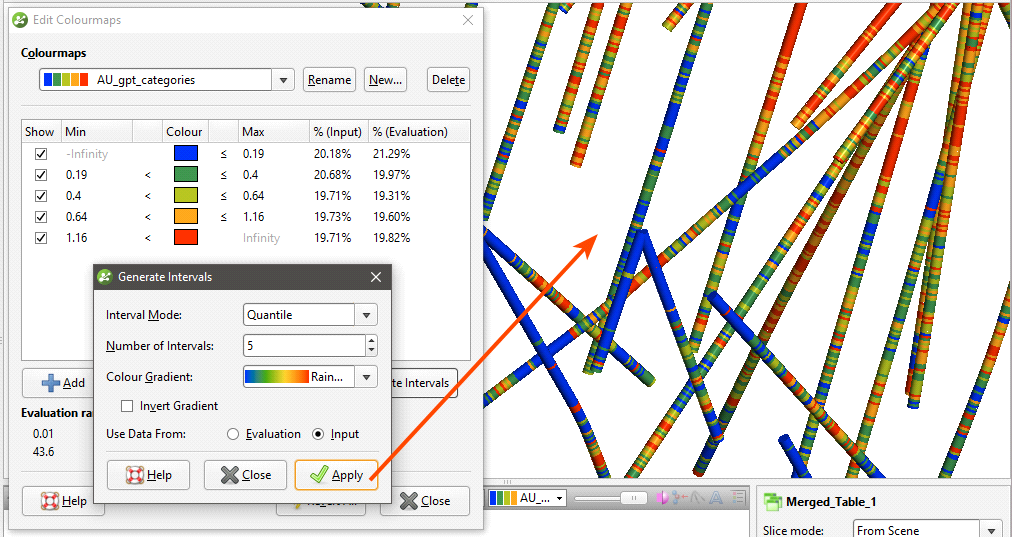
See Discrete Colourmaps for more information.
Colour Gradient Options
New colour gradient options have been added, replacing the previous colourmaps. The new maps better display heatmaps, elevation, azimuth and geophysics data, as well as diverging data and grayscales. The previous colourmaps can still be used, if preferred.
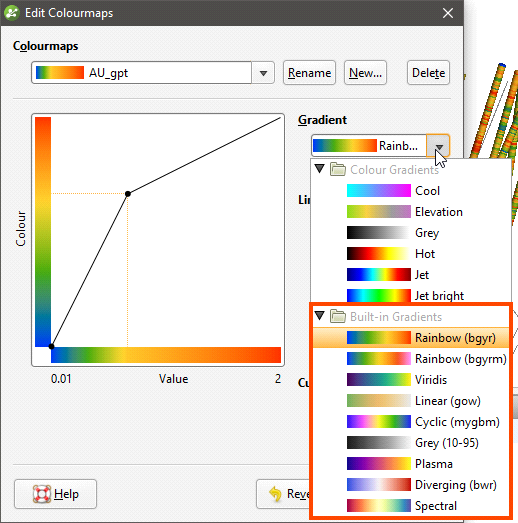
See Continuous Colourmaps for more information.
Add X = Y Line to Scatter Plot
An X = Y line reference has been added to scatter plots.
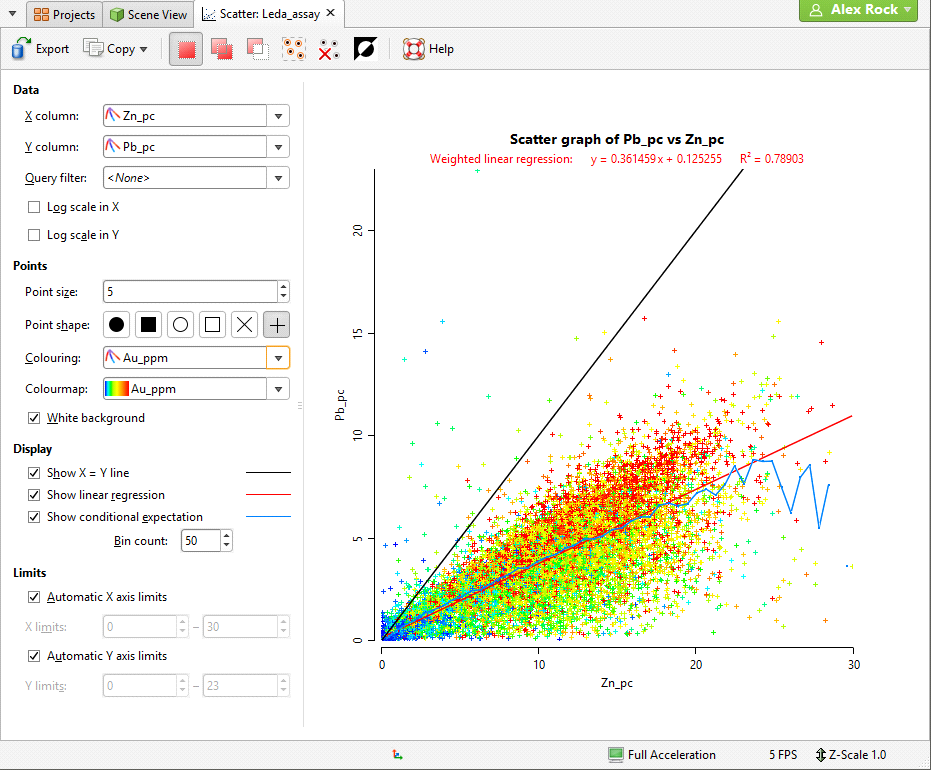
See Scatter Plots.
Extract Volume Surfaces
Because Leapfrog Geothermal dynamically constructs solids from surfaces based on cutting rules, the input surfaces do not necessarily reflect the output volume’s contact surfaces. In some cases, the input surface may extend beyond the limits of cutting.
New single-action surface extraction tools allow for the easy extraction of the younger or older surfaces of a given volume, (or any of the unique contact surfaces that make up a volume), avoiding the need for extensive mesh clipping.
See Extracting Model Volumes for more information.
Improved Line Symbology in Cross Section Layouts
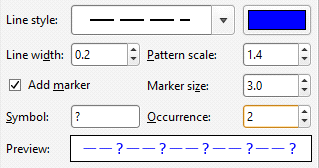
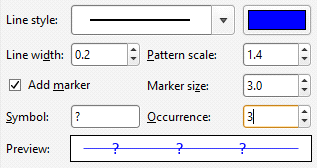
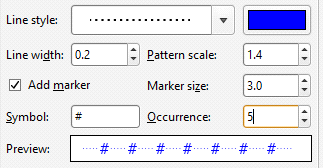
Line styles and point symbology on lines are commonly used to convey the status of geological interpretations on 2D cross sections. Use the new line symbology tool in the section layout editor to clearly document and convey the confidence level of modelled contacts, or where the water table is on your dynamically linked cross sections.
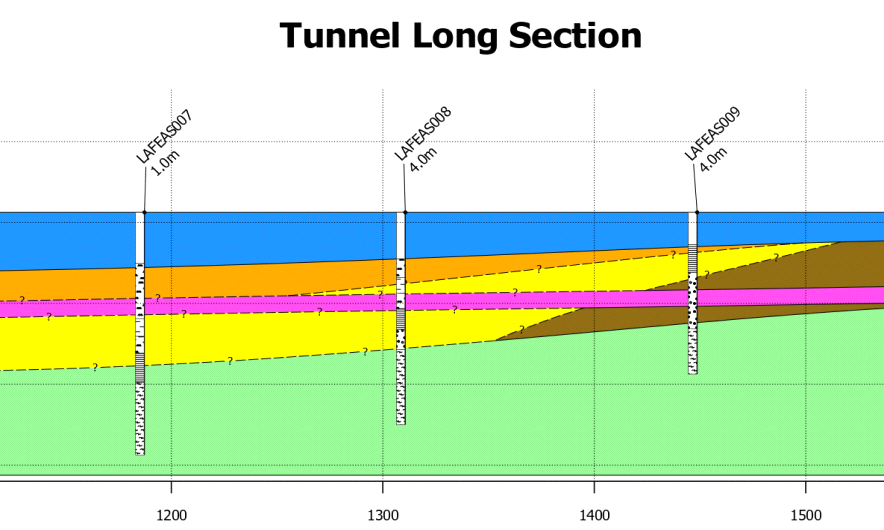
You can see below how changes to the Line style, Symbol and Occurrence can be used to indicate different conditions:
|
|
|
|
|
|
See Adding and Styling Surfaces for more information.
Improved Set Elevation Tool
There is a new option, Leave unchanged, in the Set Elevation window. This option handles the z values of points that don’t need to be projected onto the selected surface.
See Setting Elevation for Points for more information.
Connectivity Via Proxy
There is a new Network panel in the Settings window for setting up proxy connections. See Network Settings for more information.
Block Model Export to Surpac
The block model exporter wizard now exports to Surpac (format versions 3.2 and 5.0). Specify export choices, such as evaluated items and character sets or apply filtering.
Please note, export of Surpac format sub-blocked models is not supported. If your block models are larger than 512 blocks per side, Surpac format version 5.0 must be used.
See Exporting Block Models in Surpac Format for more information.
Got a question? Visit the My Leapfrog forums at https://forum.leapfrog3d.com/c/open-forum or technical support at http://www.leapfrog3d.com/contact/support