
Formula Gallery
The formula gallery contains examples of formulas that solve specific problems. In these examples, we use activity, column, table and field names that will help you to understand how the formula has been constructed and where information used in the formula is coming from.
- Formulas Using Ranked Columns
- Formulas for Data Selection
- Formulas Using Data from Previous Row
- Formulas Using Header Field Inputs
- Formula Using the in Function
- Formula Using the Modulo Function
- Formulas Using Date Functions
- Formula Using Search Function
- Formulas Using External Input Columns for Cross Table Calculations
If you want to use one of these formulas in your own tables
- Click the Copy button for the code example.
- Paste the example into the formula editor.
- Change the input names to match your own if needed.
Formulas Using Ranked Columns
Ranked columns are set up when configuring sampling in activities. See the topic for more information.
Au-Equivalent
This is a formula using ranked columns to calculate Au equivalent, the constant 1.58 is an example used to demonstrate where you can insert your own constant. Ranked columns are in the samples table and are populated with data once the lab certificate has been released.
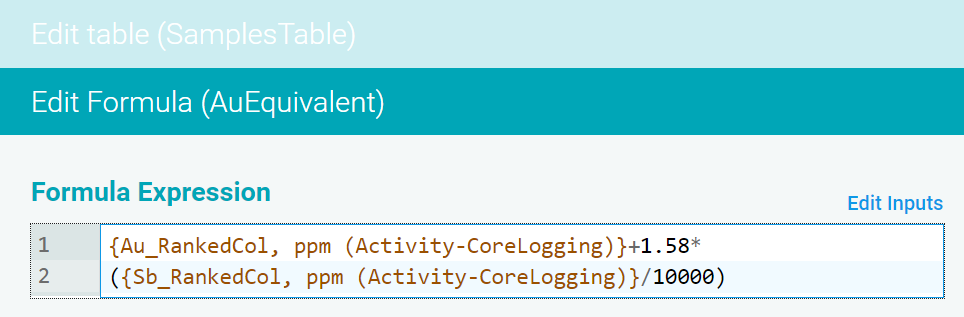
{Au-DD_RankedCol, ppm (Activity-DD CoreLogging)}+1.58*
({Sb_RankedCol, ppm (Activity-DD CoreLogging)}/10000)
Oxide Calculation
This is a formula that converts the pure LA (Lanthium) laboratory result into LA 203 ppm. The formula multiplies a ranked column, La ME-MS61_RankedCol, with the constant 1.1728. The La ME-MS61_RankedCol is a result column that has been converted into a ranked column so that it can be used for the offset calculation. As with the preceding Au-Equivalent formula, the constant 1.1728 is just an example used to demonstrate where you can insert your own constant.
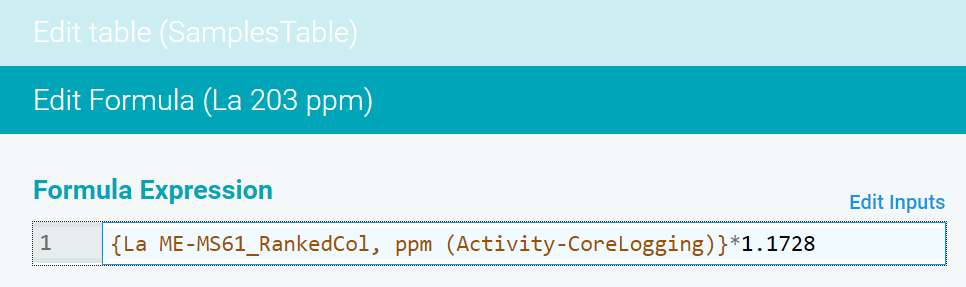
{La ME-MS61_RankedCol, ppm (Activity-DD CoreLogging)}*1.1728Formulas for Data Selection
Merging Field Sample Weight and Lab Sample Weight Columns
This formula selects data from cells that are populated and ignores cells that are empty. It accomplishes this by merging two columns, putting preference of one column's information over the other. In this example, the result will be the field sample weight; if the field sample weight has not been logged, it will be the lab sample weight.
Here a calculated column, Master Weight, has been added to the SamplesTable with a formula that first looks for the sample weight in the Field Sample Weight column.
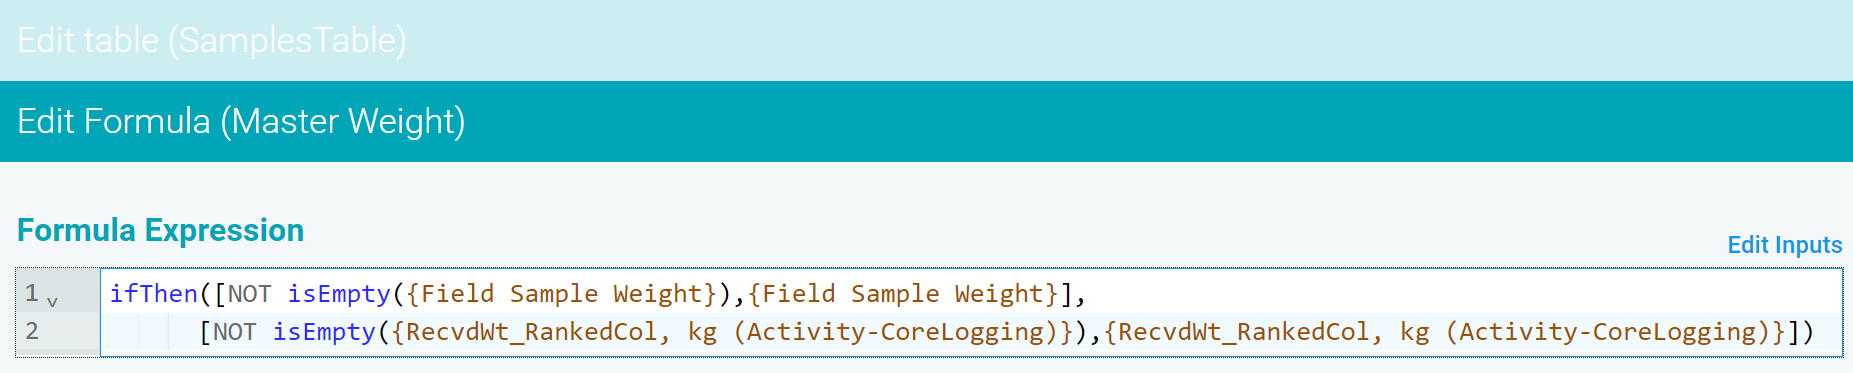
If it is not empty, then the field sample weight will display in the Master Weight column, but if it is empty, then the formula will look for the sample weight in the RecvdWt_RankedCol. The RecvdWt_RankedCol is a result column of the lab sample weight received that has been converted into a ranked column.
ifThen([NOT isEmpty({Field Sample Weight}),{Field Sample Weight}],[NOT isEmpty({RecvdWt_RankedCol, kg (Activity-DD CoreLogging)}),{RecvdWt_RankedCol, kg (Activity-DD CoreLogging)}])Combine/Merge Data from Ranked Columns Across Different Activities
Use a formula like this if you have multiple activities, i.e. RC and Diamond drilling in a project area, and you want the data from both columns to display in one merged column. Since ranked columns are configured at the activity level when the data is exported, the assay results are split across two columns, e.g. Au-DD_RankedCol and Au-RC_RankedCol, however for modelling reporting it is easier to see these results in one column. This formula to combine them solves that.
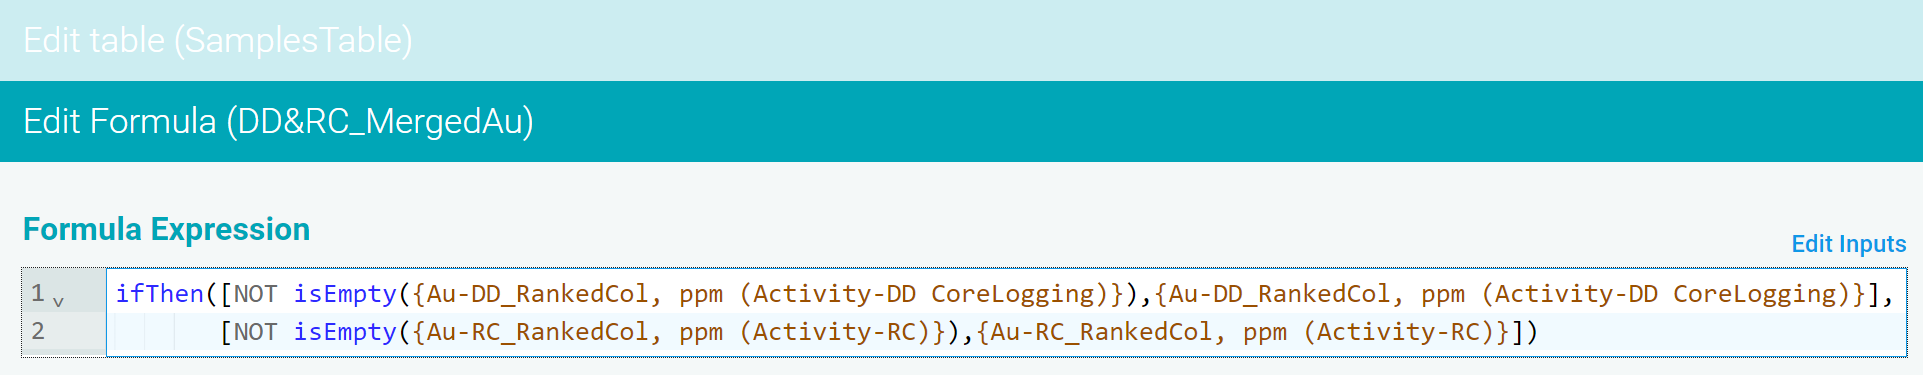
ifThen([NOT isEmpty({Au-DD_RankedCol, ppm (Activity-DD CoreLogging)}),{Au-DD_RankedCol, ppm (Activity-DD CoreLogging)}],[NOT isEmpty({Au-RC_RankedCol, ppm (Activity-RC)}),{Au-RC_RankedCol, ppm (Activity-RC)}])Formulas Using Data from Previous Row
Box Number
This formula calculates the box number by starting at 0 and adding 1 to each new row created. If you are creating a new column instead of adding a formula to an existing column, first create the Box Number column as a standard numeric column, without the calculated button toggled to yes, then save the column. Next go back into the column and add the formula to it. If the column is not first saved, it will not display as an input option for your formula.
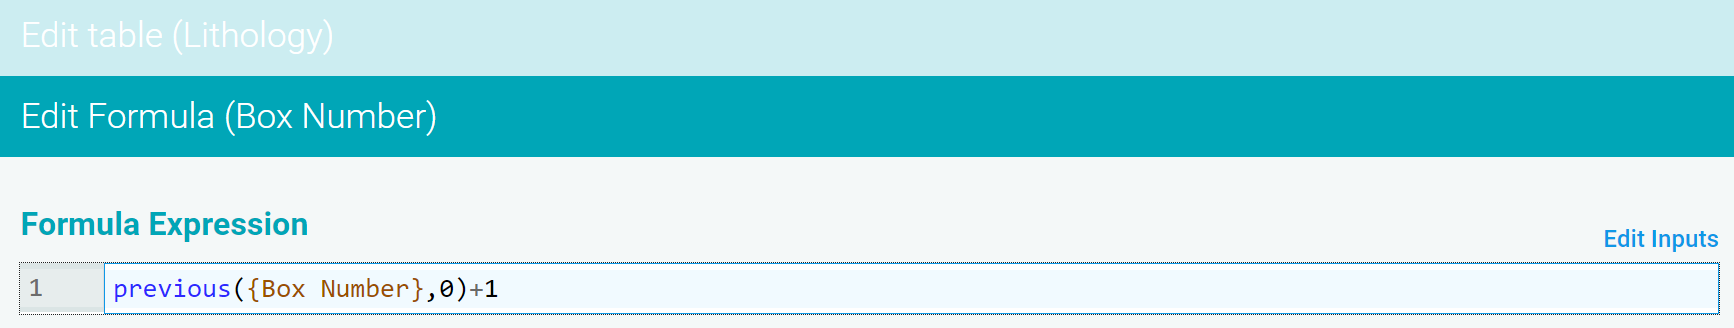
previous({Box Number},0)+1Sample Weight Check
This formula checks the FieldDup Weight against the Original Sample Weight and checks the variance between them. When adding the new column select text type, not numeric, since the formula is returning with the text Check Weight.
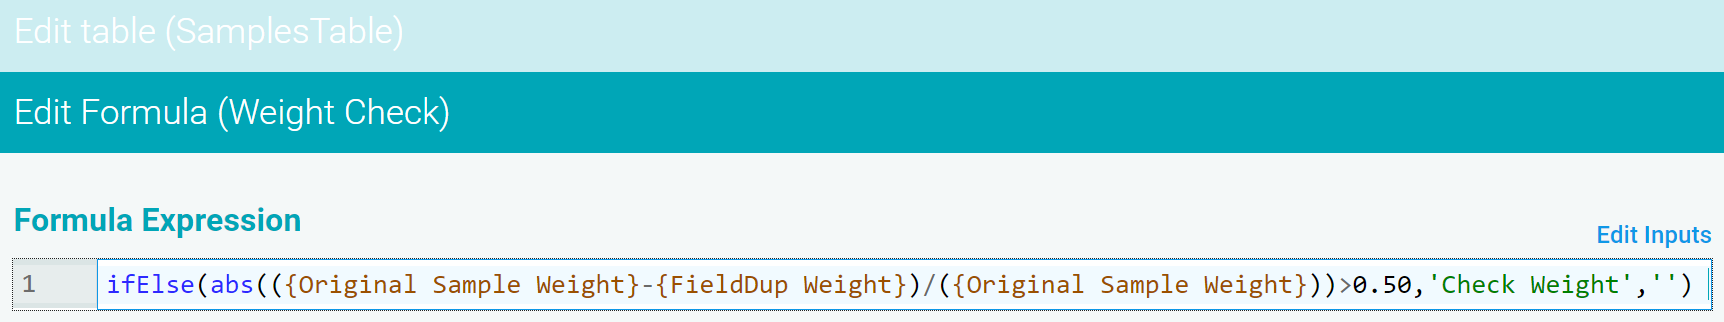
ifElse(abs(({Original Sample Weight}-{FieldDup Weight})/({Original Sample Weight}))>0.50,'Check Weight','')Deviation in Azimuth Values
Use a previous row to calculate a percent difference. If the difference is greater than 10%, flag it to check since there is an excessive deviation from this reading to the next.
You cannot use the previous function for a column that is also used elsewhere in a function. For instance, the following function fails with a 'An argument of the function has an inappropriate type' error:

The example below demonstrates how to achieve the desired objective using the previous function.
First, create a calculated column that uses the previous function to obtain the value from the previous row for the column of interest:
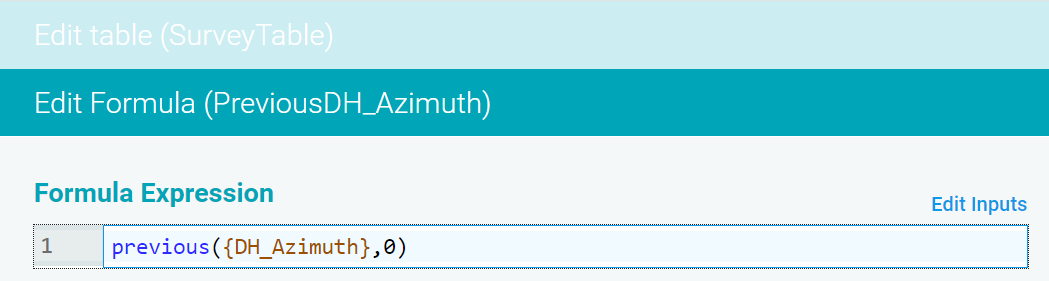
previous({DH_Azimuth},0)Next, use the new calculated column in the desired formula. Here the difference between the current and previous azimuth values is obtained and divided by the current azimuth, and the absolute value of this is compared to see if it is more than 0.1. If the difference between adjacent azimuth values is more than 10%, this new created column will put 'Check Az' in the column to flag a potential problem.
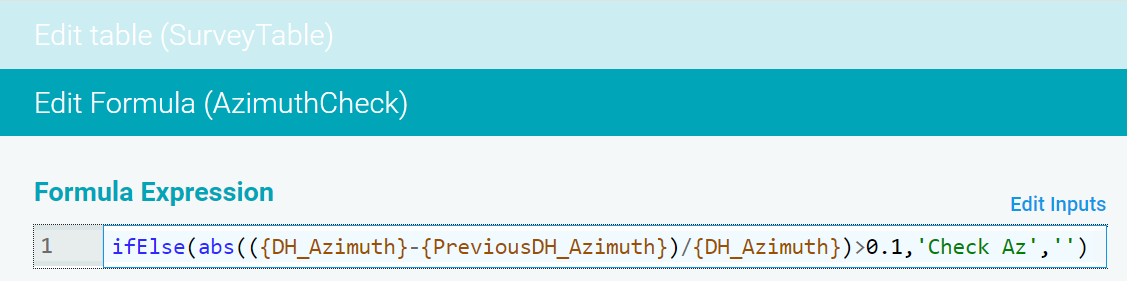
ifElse(abs(({DH_Azimuth}-{PreviousDH_Azimuth})/{DH_Azimuth})>0.1,'Check Az','')Formulas Using Header Field Inputs
Project Area Header Field Reference
This formula simply references a header field. In this example, it references the Project Area.
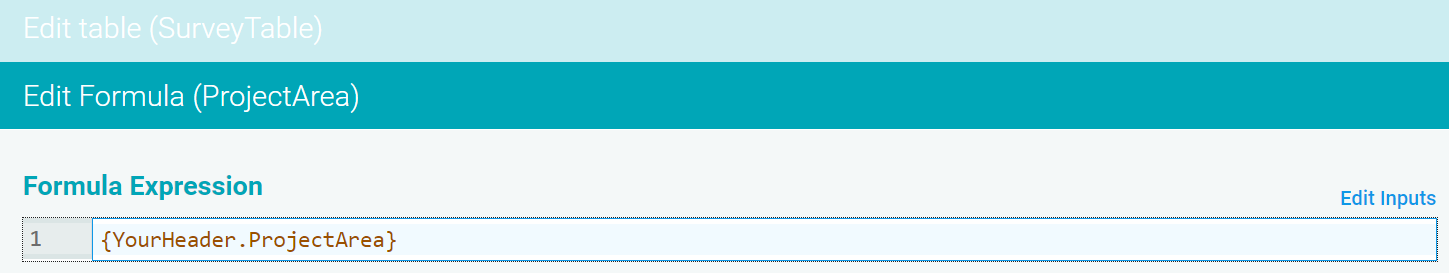
{YourHeader.ProjectArea}Depth Check Against Target Depth
This formula works as a validation to check if the depth runs past the target depth. The target depth is taken from the header.
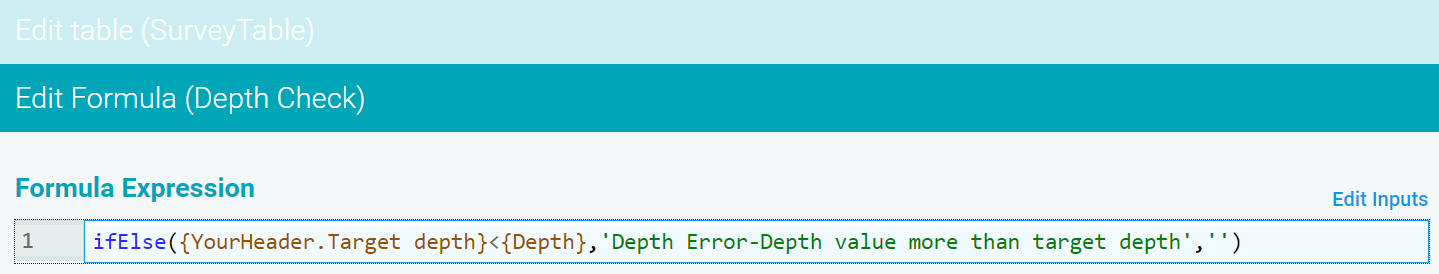
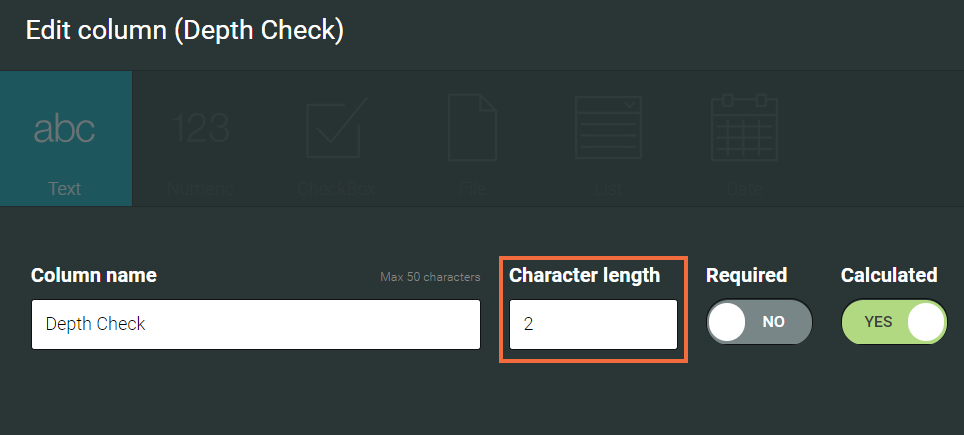
ifElse({YourHeader.Target depth}<{Depth},'Depth Error-Depth value more than target depth','')When the Character length is set to less than what the text return character length is, you can have the cell highlighted red to identify it as a warning while logging in the survey table.
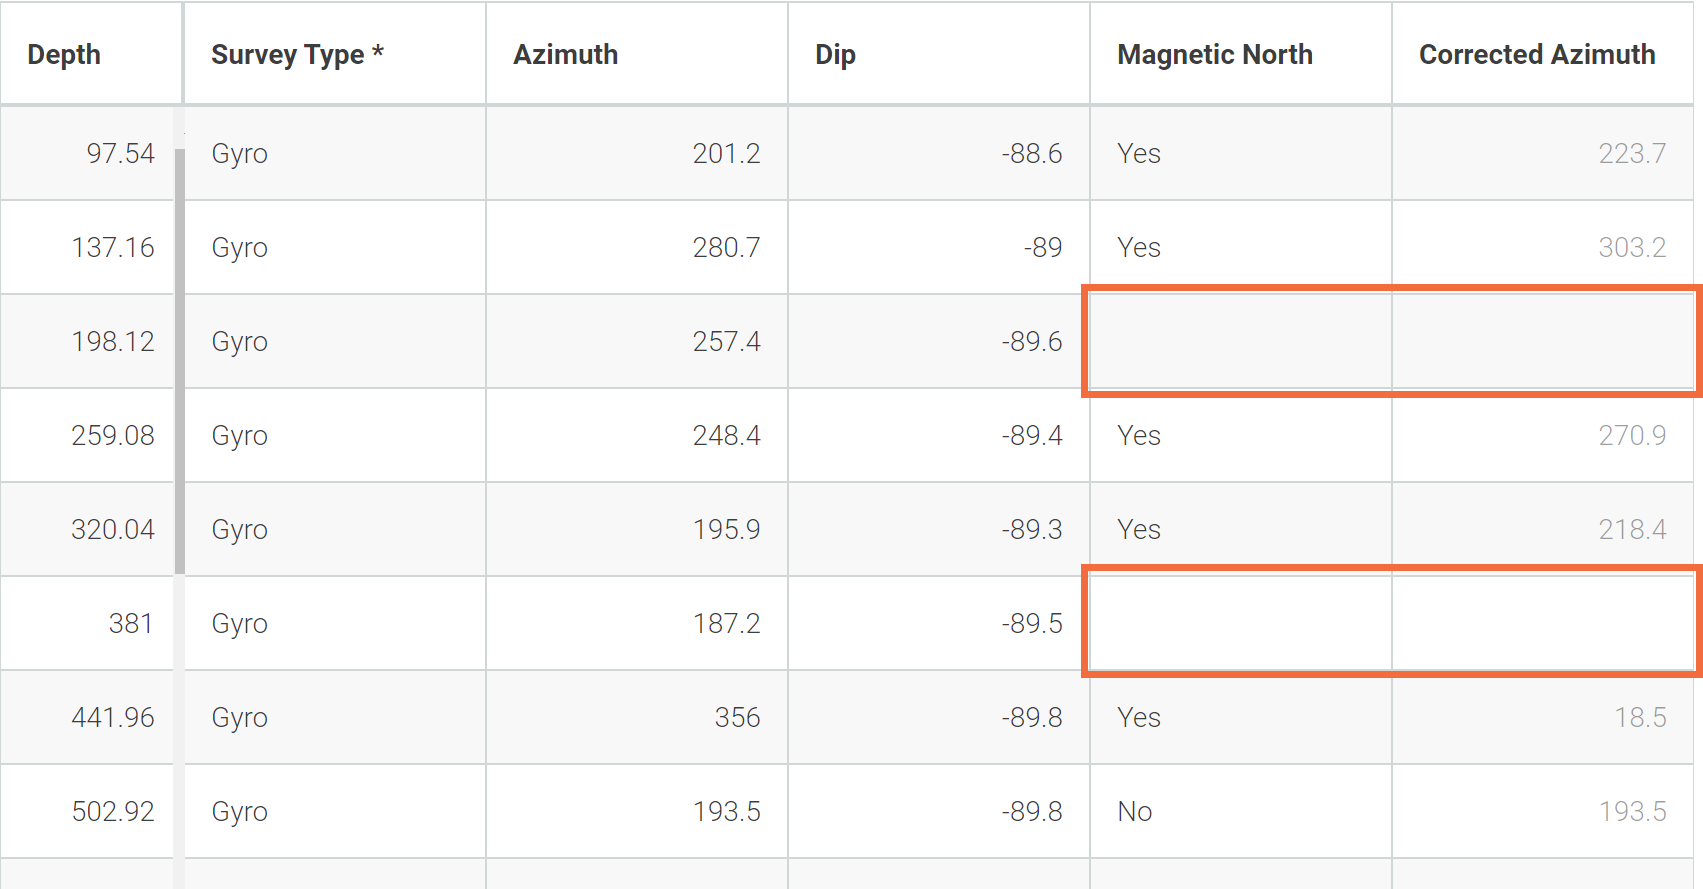
True Azimuth
Here, a flag in the survey table indicates if the Azimuth value is relative to True North or Magnetic North. If the value is relative to Magnetic North, the Corrected Azimuth is calculated using the header field input for the Magnetic Declination. Otherwise, no correction is needed to provide the true azimuth direction.
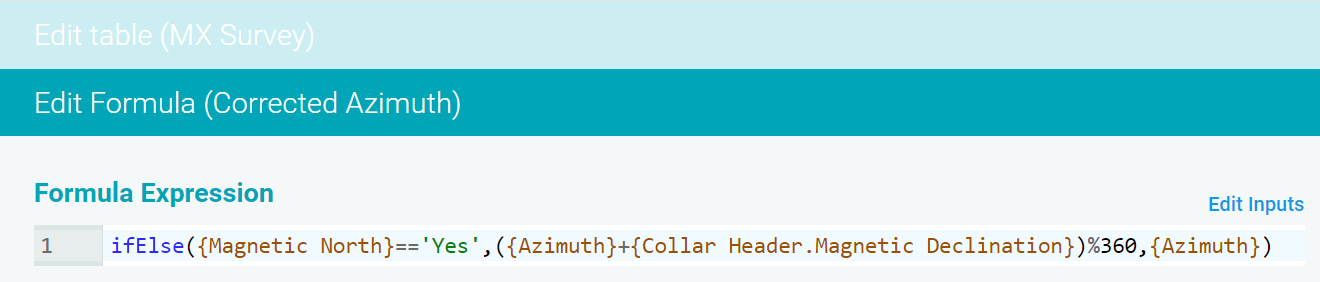
ifElse({Magnetic North}=='Yes',({Azimuth}+{Collar Header.Magnetic Declination})%360,{Azimuth})To guarantee a result in every row for Corrected Azimuth, the Required field for Magnetic North in Edit Inputs needs to be turned off. Without this adjustment, blank values for Magnetic North will produce blank results for Corrected Azimuth.
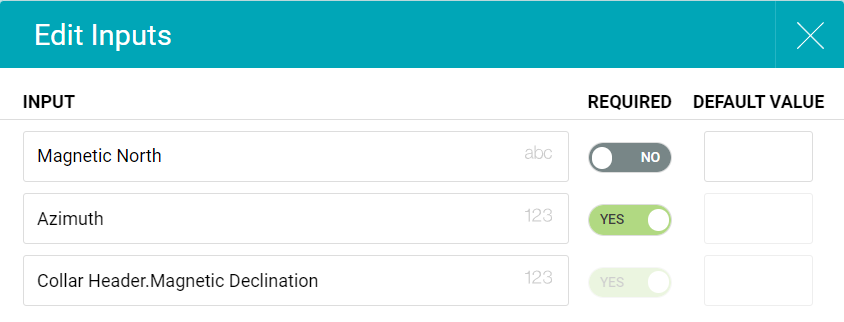
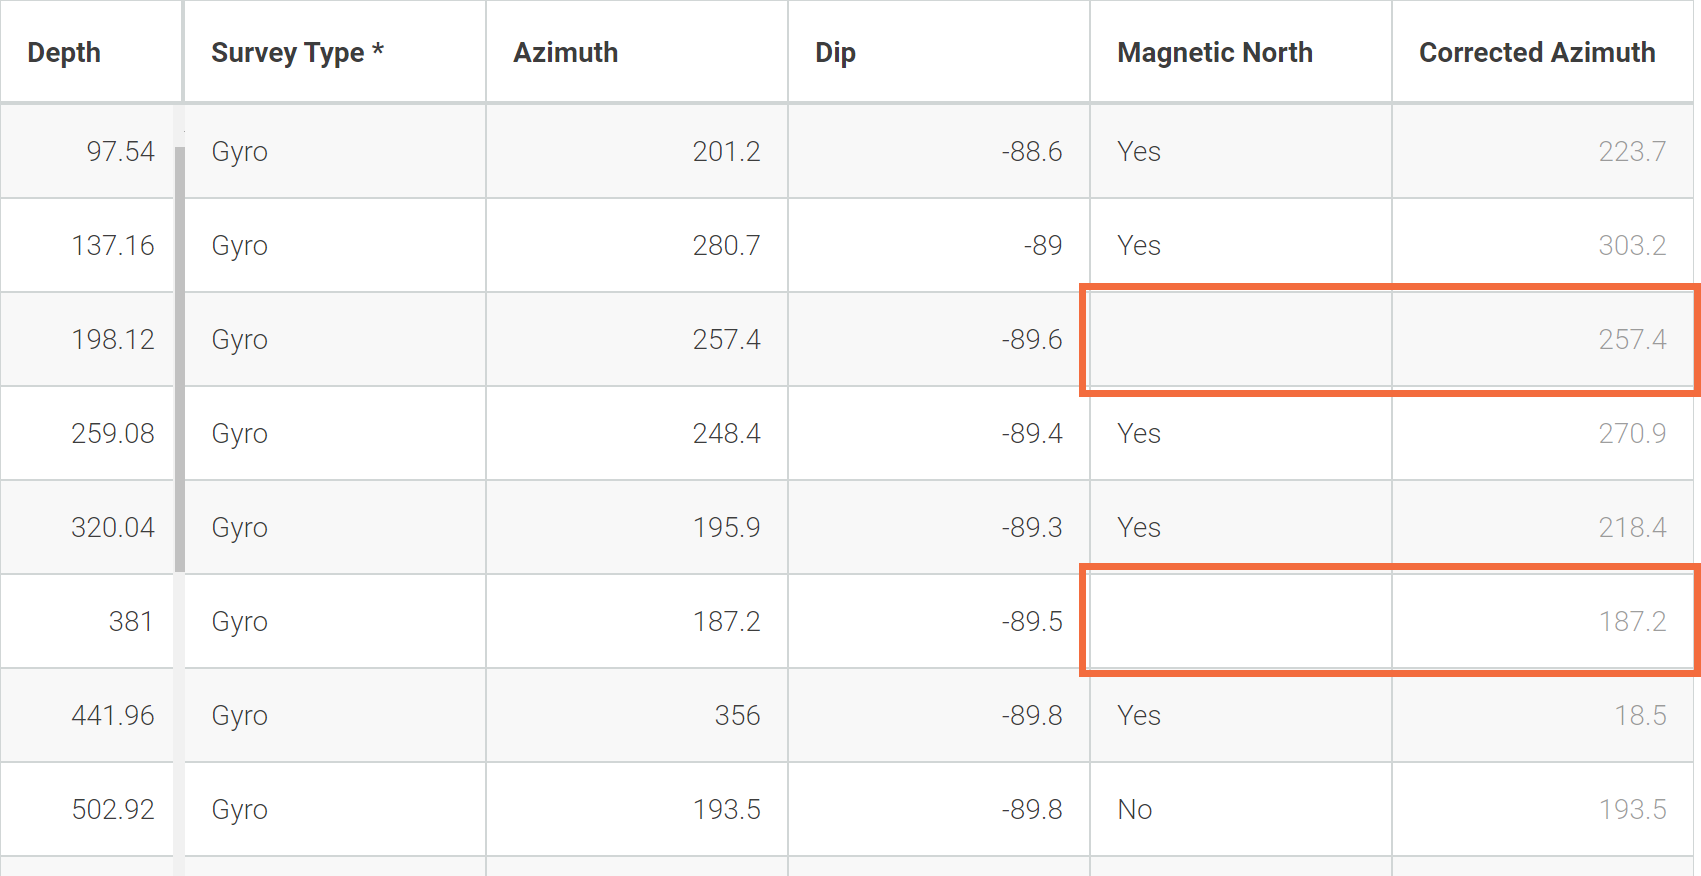
Click Edit Inputs, then turn off Required. Because the ifElse conditional function is only testing for 'Yes' there is no need to set a Default Value to make the function operate. See Required Setting for Edit Inputs for more information.
The resulting table will then look like this:
Formula Using the in Function
Sample Type Prompt
This is a sample type prompt formula that prompts the logger to add a field duplicate or blank when logging samples. Here, the formula specifies that every 20th sample logged should be a duplicate and that every 5th sample logged should be a blank.
This formula looks at the Sample Number as a base for its prompt. When the rightmost 2 digits of a sample number contain the numbers 20, 40, 60 or 80, then the prompt Insert FieldDup will appear in the calculated column. In the same way, when the rightmost digit of the sample number contains a 0 or 5 then the prompt Insert Blank will appear in the calculated column.
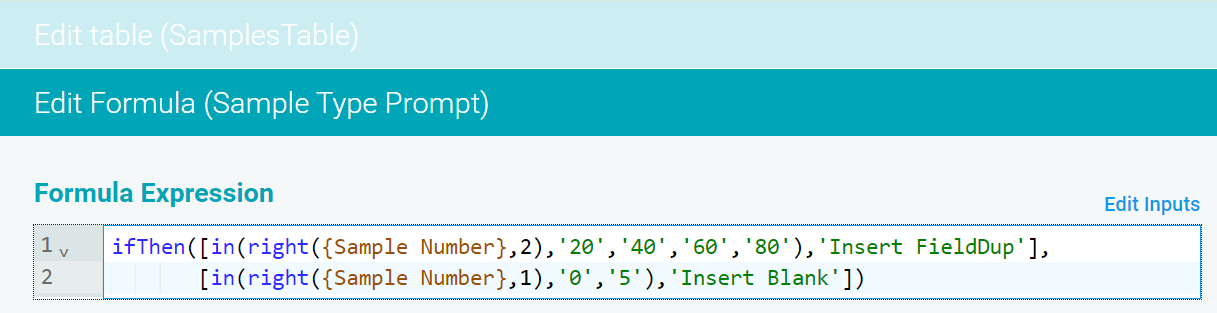
ifThen([in(right({Sample Number},2),'20','40','60','80'),'Insert FieldDup'],[in(right({Sample Number},1),'0','5'),'Insert Blank'])Formula Using the Modulo Function
Sample Type Prompt Using Modulo
This formula is a sample type prompt that uses the modulo function. This formula doesn't rely upon a pre-existing sample number, instead it also uses a Count column that simply assigns row numbers so that the you can specify the intervals at which the prompt should appear.
First create a Count column that uses the previous function to assign a row number starting at 1:
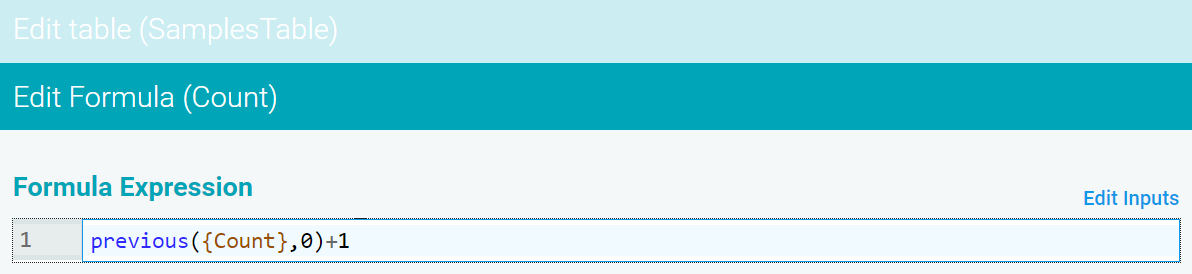
previous({Count},0)+1Next, use the new calculated column in the desired formula. Here every seventh row will have value of BLANK, CRM or DUP to prompt the logger to insert a different sample type.
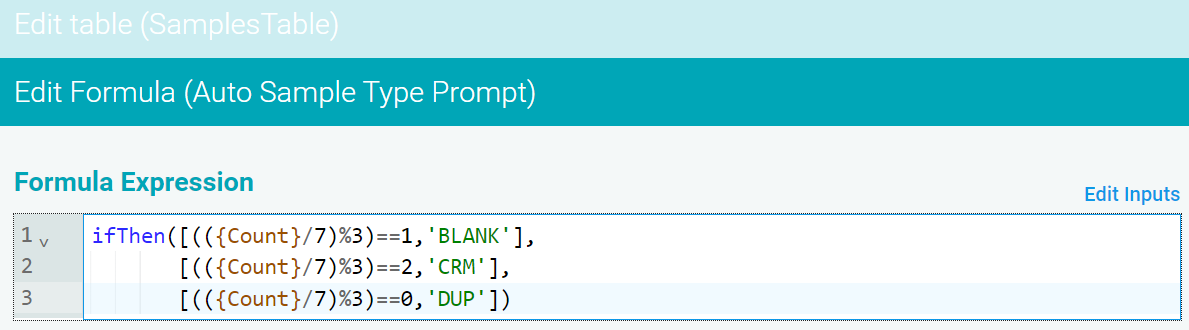
ifThen([(({Count}/7)%3)==1,'BLANK'],[(({Count}/7)%3)==2,'CRM'],[(({Count}/7)%3)==0,'DUP'])Formulas Using Date Functions
Expected Date
With this formula you can set a date for when you expect the laboratory to give you results. In this case it is 15 days.
The formula looks at the DateDispatched column, adds 15 days and returns the ExpectedDate. When you add this new column to your table it should be set to the date type format since the formula will return a result in date format.
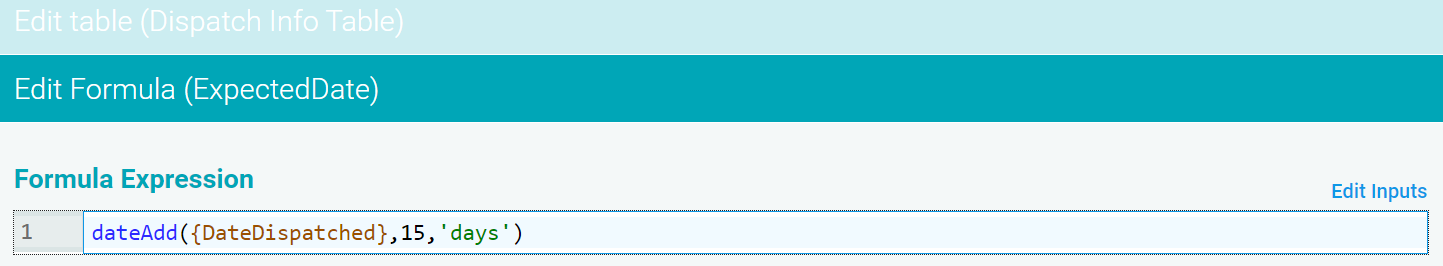
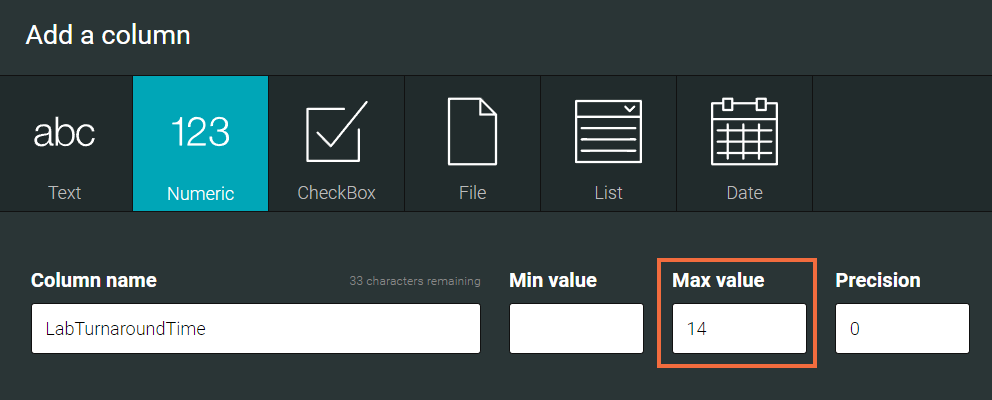
dateAdd({DateDispatched},15,'days')Turnaround Time
This formula calculates the turnaround time for lab results.
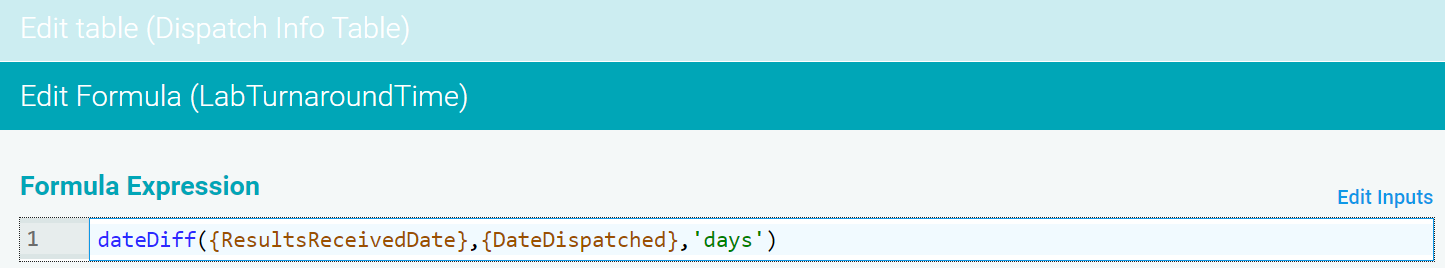
dateDiff({ResultsReceivedDate},{DateDispatched},'days')Since the formula will return a result as a number, the column type should be set as a Numeric column type. You can also set the max value to a time one day less than when you expect to receive the results. In this case it is 15 days from dispatched date so the Max value has been set to 14, so that if the turnaround is 15 or more days, the cell in the table will be flagged red.
Delayed By in Days
This formula is a combination of the two preceding formulas. It will show in days the delay of lab results by using the ExpectedDate and the LabTurnaroundTime.
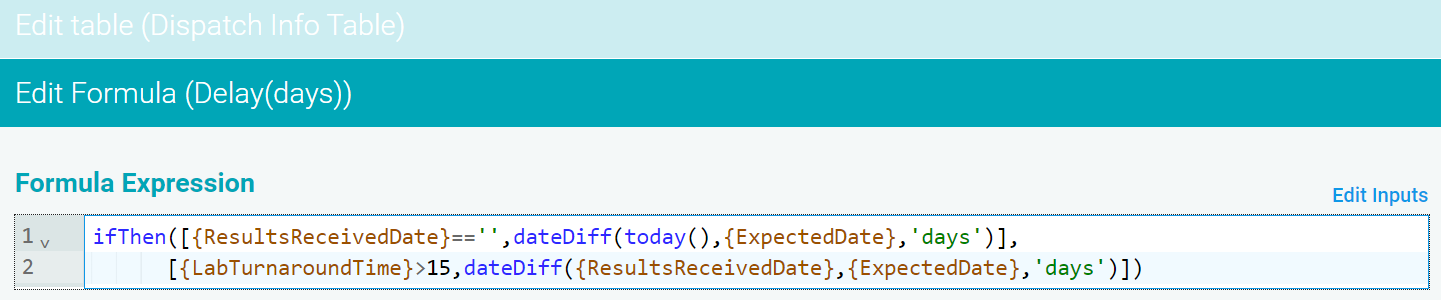
ifThen([{ResultsReceivedDate}=='',dateDiff(today(),{ExpectedDate},'days')],[{LabTurnaroundTime}>15,dateDiff({ResultsReceivedDate},{ExpectedDate},'days')])Formula Using Search Function
Validate Sample ID Using String Functions
This formula states that three criteria that must be met in order for a Sample ID to be regarded as valid. It checks that the Hole/Point.Number and the DateSampled have 24 in them, and that the SampleID starts with 444. If any of these checks are false, then it will return with Invalid Sample ID.
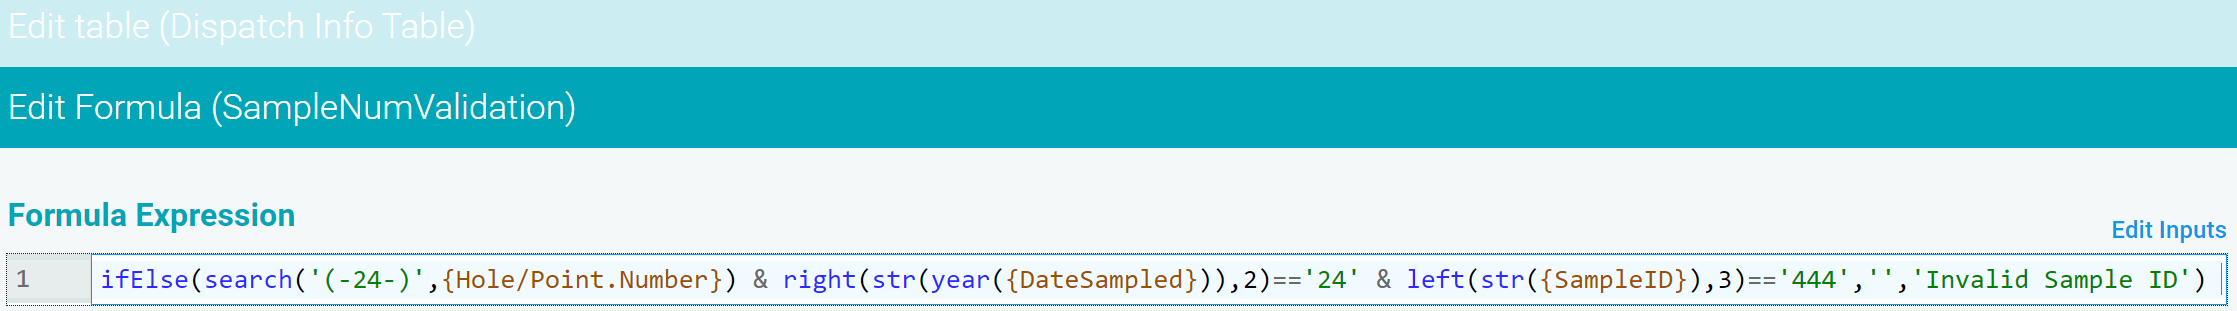
ifElse(search('(-24-)',{Hole/Point.Number}) & right(str(year({DateSampled})),2)=='24' & left(str({SampleID}),3)=='444','','Invalid Sample ID')Formulas Using External Input Columns for Cross Table Calculations
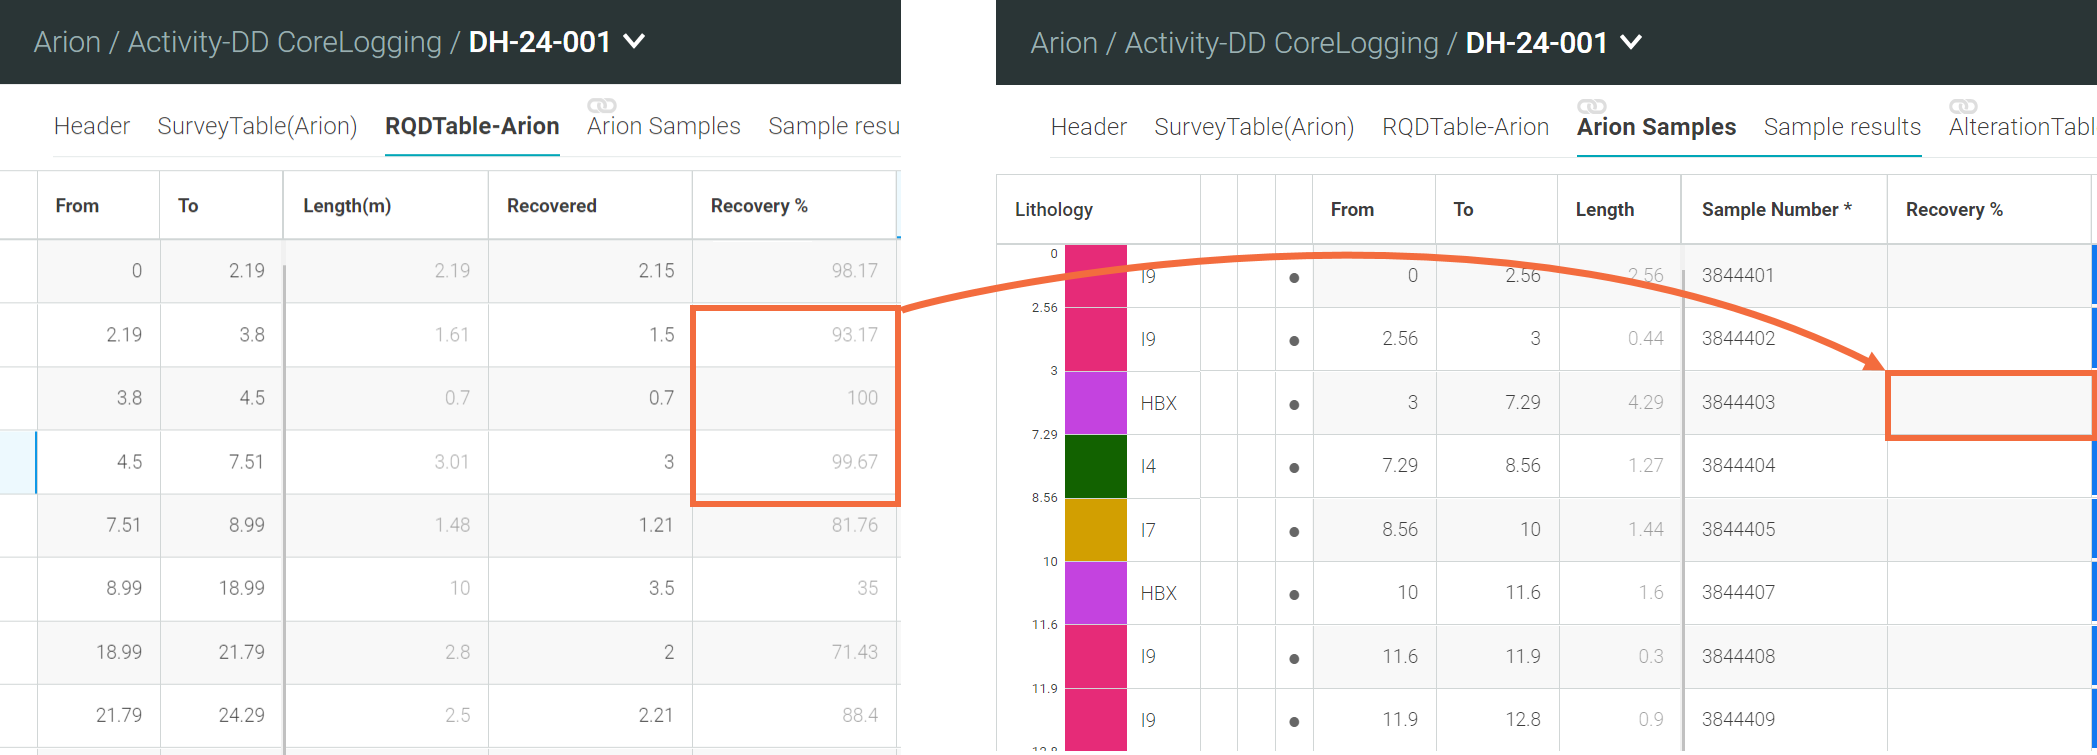
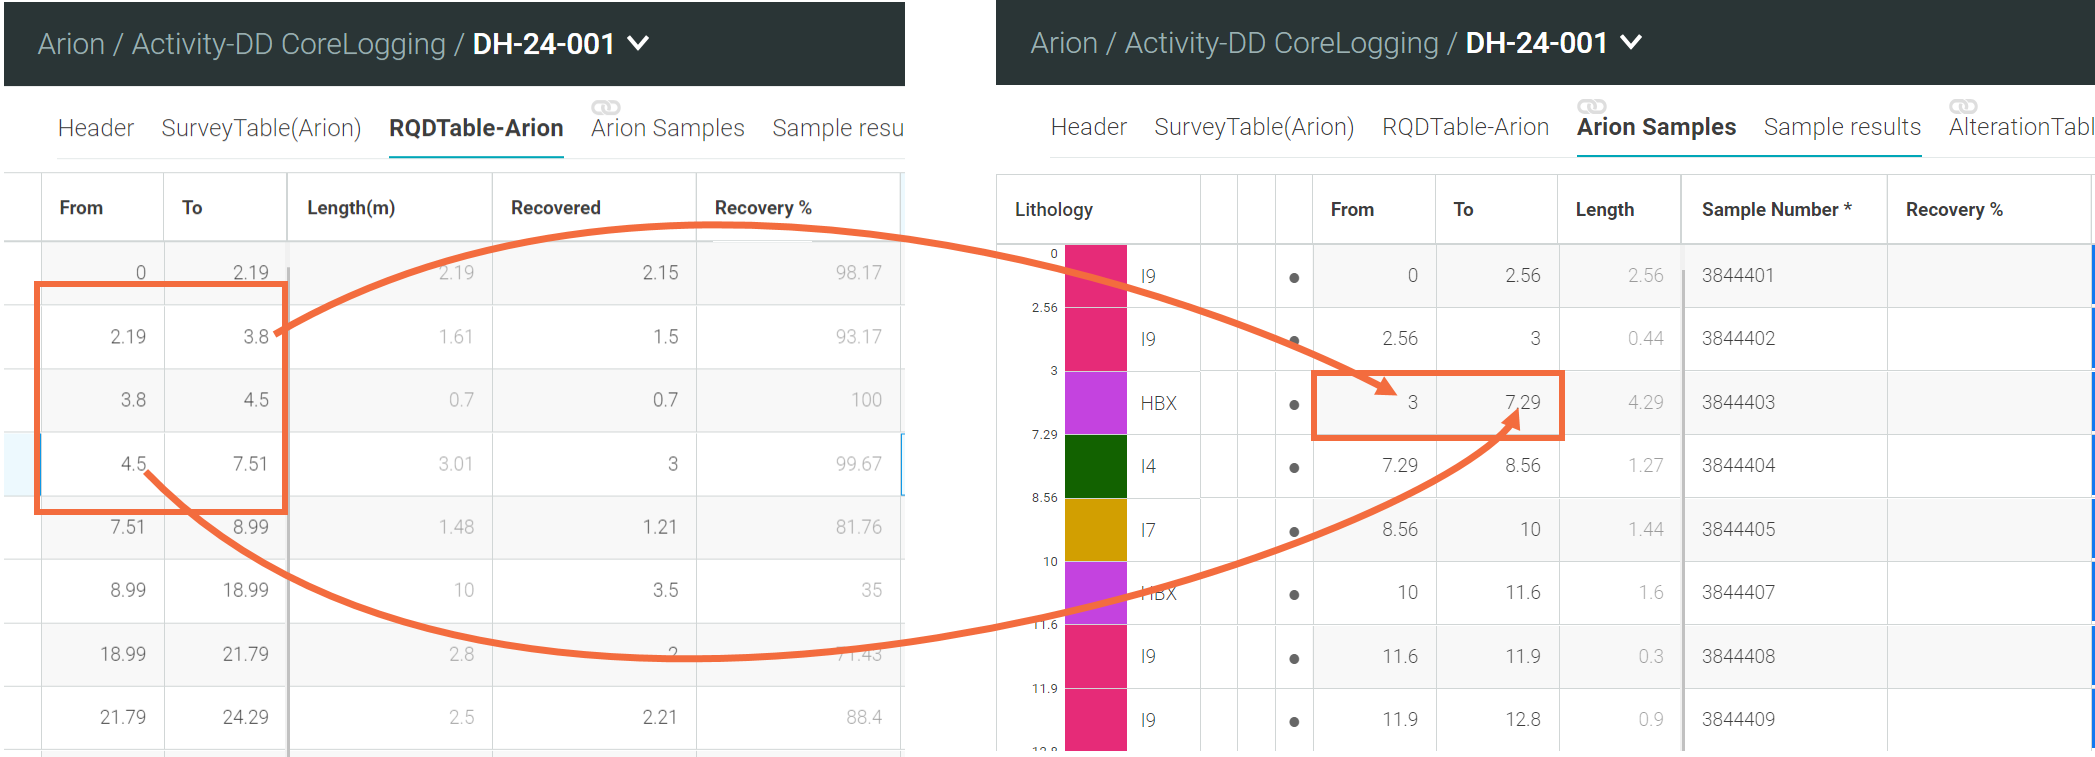
Obtain Recovery % From RQD to Samples Table When Intervals are Mismatched
External Input uses sorting and filtering to obtain information from another table, identifying corresponding rows even when the tables’ rows do not match. In this example, we see a common situation where the intervals defined in each table are different.
Here we want to populate the Recovery % in the Sample table using data from the RQD table. Highlighted are three Recovery % values in the RQD table that could be used for Recovery % in the corresponding row in the Samples table.
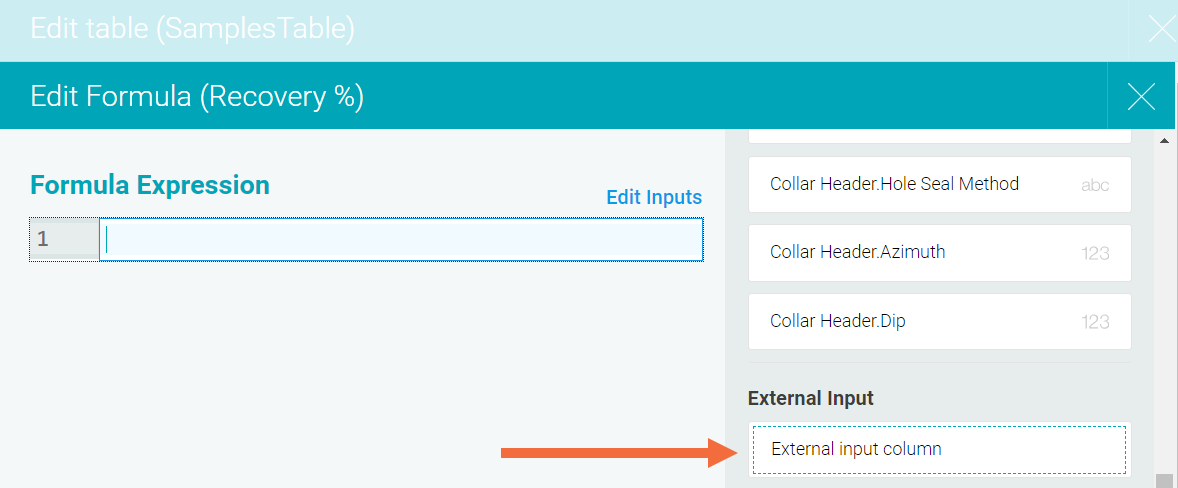
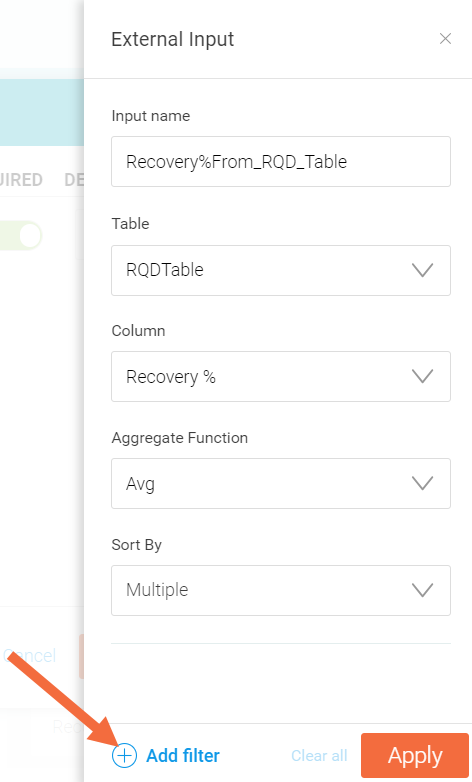
Open the formula editor and select External input column from the side panel.
To identify the corresponding rows and extract the information needed for the destination table:
- Select the source Table and Column
- Select an Aggregate Function to obtain the most representative value from multiple values in the external table
- Select the columns in the Sort By dropdown menu
- Select Add filter to filter the rows in the selected columns from the table you are editing
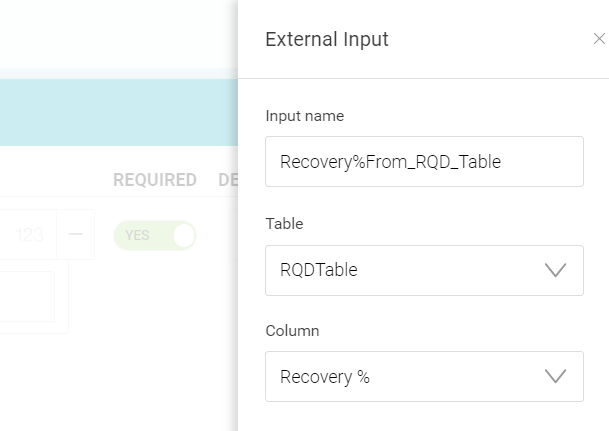
Complete the Input name field that will be used in the Formula Expression, and select the external source Table and Column. Here we have chosen to obtain the Recovery % column found in the RQD Table.
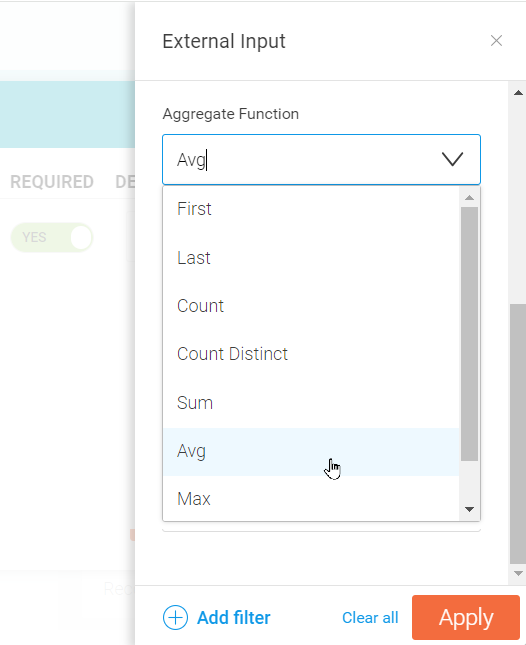
The Aggregate Function is applied to the corresponding rows in the source table that match the filter that will be applied. The available options are:
- First. The Column value from the first row in the source table that matches the filter
- Last. The Column value from the last row in the source table that matches the filter
- Count. The number of rows in the source table that matches the filter
- Count Distinct. The number of rows in the source table that matches the filter with unique values in the Column
- Sum. The sum of all the values in the Column for the rows in the source table that matches the filter
- Avg. The arithmetic mean of all the values in the Column for the rows in the source table that matches the filter
- Max. The largest of all the values in the Column for the rows in the source table that matches the filter
- Min. The smallest of all the values in the Column for the rows in the source table that matches the filter
Here, we have chosen to specify the Avg of the rows that contain data within the range that will be specified using the next two steps:
The next step is to use the Sort By menu to specify how the external source table will be ordered prior to filtering:
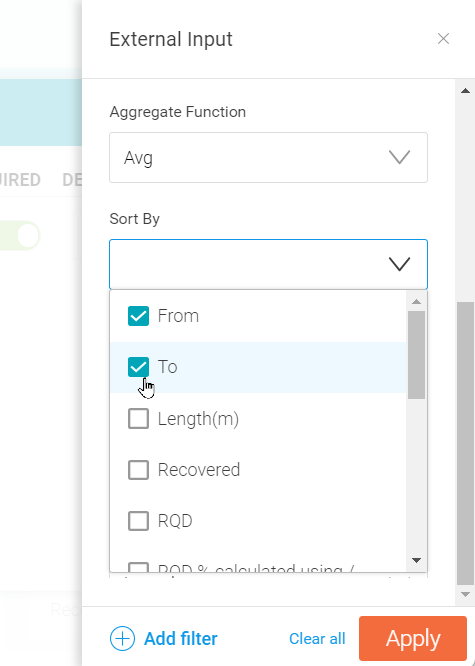
This is especially important when using the First or Last aggregate functions.
When matching interval tables using From and To columns, we will need two filters. Consider the specific example in the illustration at the start of this section. We want to find all the rows that match the interval From 3 To 7.29. To do that, we need to find rows in the source table that have a To value greater than 3 and a From value less than 7.29.
More generally, we want a filter that finds To column values in the source table that are greater than the From value in the destination table, and From column values in the source table that are less than the To value in the destination table.
If, in this case, we instead selected rows in the source table that have a From value greater than 3 and a To value less than 7.29, we would only select one row and we would miss out on the use of the data contained in the adjacent rows that also relates to the interval of interest.
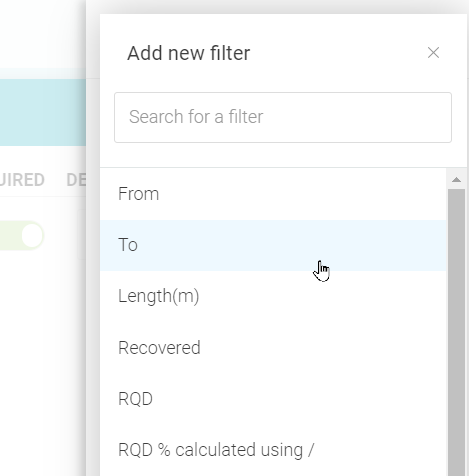
Select Add filter to add the first filter to the source table to find the rows to match with the destination table:
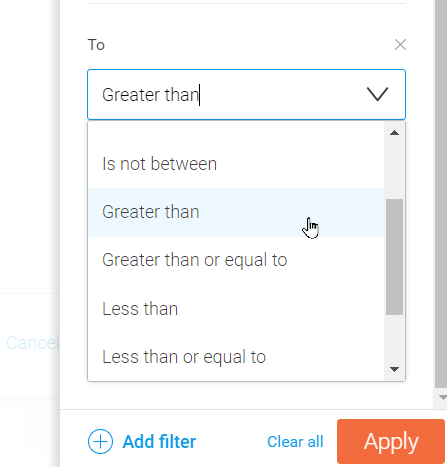
Choose a column in the external source table to use in the filter, in this case the To column of the RQD Table:
Next, we select a comparison operator from the list of options. The available options are:
- Is equal to
- Is not equal to
- Is between
- Is not between
- Greater than
- Greater than or equal to
- Less than
- Less than or equal to
- Is empty
Is empty has no additional comparison value, and Is between and Is not between both take a pair of values. All the other comparison operators take a single comparator. This can be a simple value entered into the field, or it can be a destination table column.
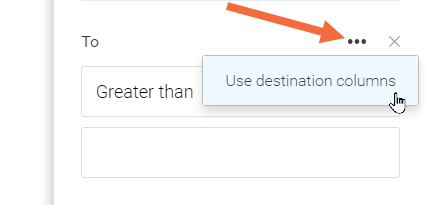
To change to using a destination column, move the mouse to the left side of the X that deletes the current filter. An ellipsis button appears, and clicking this will reveal a popup menu with a single option. Click Use destination columns.
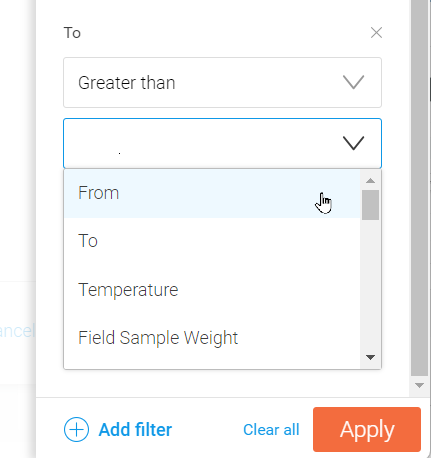
The comparator field becomes a dropdown list, where we can select from columns in the destination table. Here, From is chosen:
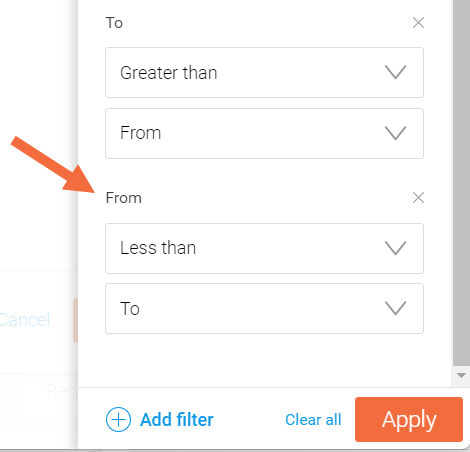
Another filter is needed to complete the selection of rows from the source table. Here we select values in the From column of the RQD table that are Less than the value in the To column of the Samples table:
Click Apply to complete the definition of the External Input. It can now be used in the Formula Expression, either by itself or as part of a larger expression.