
Data Voxel - View and Modify Attributes
Use the Attributes tab to view and modify the properties of the Data Voxel in your 3D View. For more information on clipping, refer to the Modify 3D Clipping topic. For more information on the colour legend, refer to the Modify 3D Legend topic.
-
How do you specify the transparency of the voxel?
-
How do you modify the voxel display?
-
How do you add/remove a bounding box from around the voxel?
-
How do you display the voxel statistics for visible cells?
-
How do you display the voxel properties?
-
How do you control the resolution of a voxel?
To specify the transparency of the voxel:
The transparency of the voxel can be adjusted interactively by moving the slider on the Transparency bar.
-
To interactively modify the transparency level, using your cursor, move the slider on the Transparency bar.

-
To increase the transparency, slide the bar to the right and to decrease the transparency slide the bar to the left.
To modify how a voxel is displayed:
-
Select the Fill radio button and the voxel will be displayed as filled coloured cubes.
-
Select the Edges radio button and the voxel will be displayed with cube edges only.
-
Select the Fill with Edges radio button and the voxel will be displayed with both coloured cubes and edges.
-
These radio buttons work as a toggle, selecting one toggles off the other.
To add/remove a bounding box from around the voxel:
-
Select (
 )
the Bounding box check box and a box will be added to the voxel. Unchecking the Box outline removes the box.
)
the Bounding box check box and a box will be added to the voxel. Unchecking the Box outline removes the box. -
This check box works as a toggle, you can toggle on or off the voxel box.
To display the voxel statistics for visible cells:
-
Click the Visible Cell Statistics button and the Voxel Statistics for Visible Cells dialog is displayed.
-
This dialog displays the statistics based on all visible cells (clipped data is not included). The statistics parameters displayed are, Voxel Name, Valid Data, Dummies (number of null value cells), Volume, Minimum, Maximum, Mean Value and Standard Deviation.
This dialog can remain open while performing tasks in the 3D Viewer, such as interactively clipping.
-
Click the X on the top right corner to close the dialog and return to the 3D Viewer.
To display the voxel properties:
-
Click the Properties button and the Voxel Properties dialog is displayed.
-
The voxel properties displayed are, File name, Element type, Number of cells X, Y, Z, Voxel X, Y, Z cell size, Origin X, Y, Z, Angle, Z Orientation, Coordinate system and Coordinate system units.
-
Click the Stats button to display the Voxel Statistics dialog. This dialog includes all of the voxel data values, including clipped data.
-
Click the Histogram button to view the voxel histogram. Click OK to close the dialog and return to the Voxel Statistics dialog.
-
Click the Back button to return to the Voxel Properties dialog and then click the Exit button to close the dialog.
To control the resolution of a voxel:
-
For large voxels that may experience poor performance, a resolution slider will appear below the other voxel controls.
-
If the 3D view is slow, try sliding the slider to the left, to lower the resolution of the voxel. One notch to the left will double the cell sizes of all cells in the voxel.
-
Note that this is only a change in how the voxel is rendered or drawn; there is no change to the underlying data.
Application Notes
Voxel Smoothing is a display option that allows you to view numeric data voxels using a smooth interpolation method, instead of in the default pixelated view. Note that this is only a change in how the voxel is rendered or drawn; there is no change to the underlying data.
Smooth voxel display works best when used on voxels with continuous data, that fill (or mostly fill) the entire volume. Individual or isolated voxel cells (i.e. cells with real values surrounded by dummy cells) may disappear when smoothing is enabled, since there is no nearby data to create a continuous smooth appearance.
Difference between default and smooth display methods
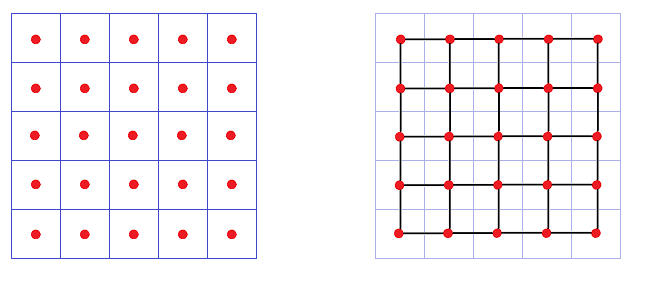
In the default display, voxels are displayed as a set of cubes or boxes. The data points that form a 3D voxel are shown as the centers of cubic cells with a certain size, where a value assigned to each point (hence to the entire cell). No interpolation is applied and cells are displayed “as is.” In the first picture below, the data points are the red dots and the blue lines are cubes we see when the voxel is rendered with the default method.
When the voxel smoothing option enabled, the actual data points (the true locations) of the 3D voxel are now interpreted as the vertices of new cells. The second picture below shows the same voxel displayed with smoothing – the red dots are still the true locations of the data points, but now the black cells are the smoothed representation of the data. With the new smoothing option, we render a narrower set of cells (black lines) and so it appears as if we lose a half of a cell around the border of the voxel.
Got a question? Visit the Seequent forums or Seequent support
© 2023 Seequent, The Bentley Subsurface Company
Privacy | Terms of Use