
Clipping Tab
Use the Clipping tab to modify the clipping regions of the 3D groups in your 3D Viewer, Voxel Viewer, or Geosurface Viewer. For more information on the attributes and the colour legend, refer to the links at the bottom of this topic.
Data Voxels
-
How do you Clip Data values using the slider or text boxes?
-
How do you Clip the X, Y, and Z ranges using the slider or data boxes?
-
How do you Set the Sensitivity of the slider?
Vector Voxels
-
How do you Clip Vector Data?
Lithology Voxels
-
How do you Clip Lithology Data?
Geosurfaces
-
How do you Clip the X, Y, and Z ranges using the slider bar or data boxes?
3D Symbols and Drillholes
- How do you Clip the X, Y, and Z ranges using the slider bar or data boxes?
Clip Voxel Data
For voxels, data values can be clipped interactively by moving the sliders on the Data bar. Data values can also be clipped manually by specifying a data range in the text boxes provided (minimum value on the left, maximum value on the right).
-
To manually specify the data clip region, click inside the Data text boxes, specify the minimum and maximum values and then press the Enter key. The voxel will be updated with the new clipped data range.
-
To interactively modify the Data clip region, use your cursor to move the bottom sliders (bottom inward facing arrows) from either end of the slider bar, as shown in the image below:
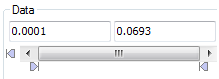
Your voxel data range will be updated interactively as you move the slider bars.
You can also move the Data range bar, which will maintain the data range while interactively changing the voxel data values.
Clip Voxel X, Y, or Z
Using the X , Y, or Z text boxes or slider bars, you can clip each of the 3D axes independently. The X (Y, Z) axis can be modified interactively by moving the individual sliders or manually by specifying an axis range in the text boxes provided (minimum value on the left, maximum value on the right).
-
To manually specify the X (Y, Z) axis clip region, click inside the X (Y, Z) text boxes, specify the minimum and maximum values and press the Enter key. The voxel will be updated with the new clipped axis range.
-
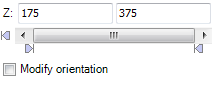
To interactively modify the X (Y, Z) axis, using your cursor, move the bottom sliders (bottom inward facing arrows) from either end of the slider bar, as shown in the image below:
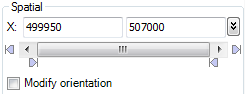
Your voxel X (Y, Z) axis range will be updated interactively as you move the slider bars.
You can also move the slider bar, which will maintain the X (Y, Z) range while interactively changing the X (Y, Z) values.
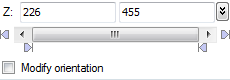
Angled Clipping
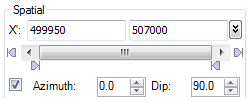
You can now also modify the orientation of the X, Y, Z axes in order to perform angled clipping. Angled clipping works for all types of groups and planes.
-
Select the Modify orientation check box underneath the range control for the X (Y, Z) axis.
This overrides the default X, Y or Z default clipping orientations, which are:
-
An azimuth of 0 and dip of 90 is equivalent to the normal behaviour of clipping in X.
-
An azimuth of 270 and dip of 90 is equivalent to the normal behaviour of clipping in Y.
-
An azimuth of 0 and dip of 0 is equivalent to the normal behaviour of clipping in Z.
-
-
The allowable azimuth values are 0 to 360 and the allowable dip values are -180 to 180 – similar to those values you see in the status bar of the 3D Viewer. The range values for modified orientation axes are based on the distance from the point (0, 0, 0) in 3D space.
-
If multiple visible items are selected in the tree, the common non-rotated clipping ranges will be shown – if it is possible to determine for each of X, Y and Z. If some groups have modified orientations and others do not, the controls will show the allowable range for the default orientations. Otherwise, the common ranges and modified orientation values will be displayed.
Set the Sensitivity of the Slider
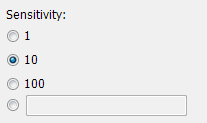
The sensitivity of the Data and X, Y, or Z sliders can be set independently, enabling you to control the data increments for each slider.
-
To set the sensitivity of the slider, click the Change Sensitivity (
 ) drop-down button
to the right of the text display windows. The Sensitivity dialog will be displayed.
) drop-down button
to the right of the text display windows. The Sensitivity dialog will be displayed.
-
Using the radio buttons, select the increment value that best reflects your data, or you can add a specific value in the text box provided. Press the Esc key, or click anywhere inside the 3D Viewer to close the dialog and set the sensitivity of the current slider.
-
Move the slider and you will observe that the slider values move using the selected increments.
Clip Vector Voxel Data
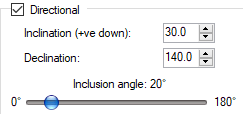
Vector voxels, in addition to the aforementioned clipping options, can be directionally clipped. The 3D direction is defined with 2 angles: the declination (azimuth) and the inclination (dip). If the vector voxel is generated by VOXI, this information is within, and the corresponding entries will be auto-populated. By default, vectors in all directions are displayed. You can clip the vector data by defining the predominant bearing along with the aperture width.
-
To manually specify directional clipping, check the Directional option. This section is only enabled if the focus is on a vector voxel.
-
Review the Inclination and Declination first. You can change the 2 angles either by using the steppers or by directly entering the intended numeric values. The stepper increment is 10°. The declination range is -180° to 180°; the inclination range is -90° to 90°, the positive direction being along the declination.
-
To interactively modify the directional aperture, move the slider. Setting the aperture to 0°, confines the clipping to one specific direction. Setting the aperture to 180° is equivalent to no directional clipping. Moving the slider to the right increases the size of the inclusion cone.
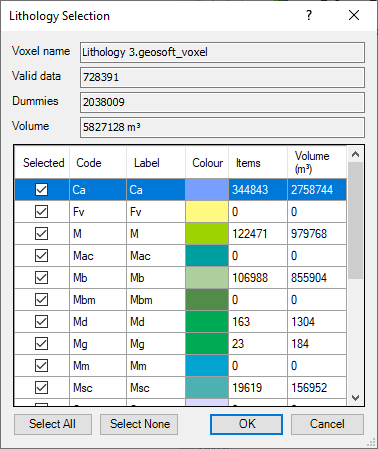
Clip Lithology Data
The Lithology Data can be clipped interactively by selecting/deselecting the geological units to be displayed.
-
To clip the lithology data, click the Lithology Selection button; the Lithology Selection dialog will be displayed.
-
Using the check boxes (
 ),
select/deselect the lithology data units to include in the voxel. Note that for
a quick selection, the
Select All or Select None buttons can be used. Click the
OK button to close the dialog.
),
select/deselect the lithology data units to include in the voxel. Note that for
a quick selection, the
Select All or Select None buttons can be used. Click the
OK button to close the dialog.
Clip Geosurface X, Y, or Z
You can clip each of the geosurface axes independently. The X (Y, Z) axis can be modified interactively by moving the individual sliders or by specifying an axis range in the data boxes provided.
-
Click inside the X, Y, or Z box, specify the minimum and maximum values and press the Enter key. The geosurface will be updated with the new clipped axis range.
-
To interactively modify the X (Y, Z) axis, use your cursor and move the slider from either end of the slider bar, as shown in the image below.
Your geosurface spatial clip values can also be updated interactively if you move the slider bar. Note that the spatial clip range will not change.
Clip 3D Symbols or 3D Drillholes X, Y, or Z
You can clip each of the X, Y or Z axes independently for 3D symbols or 3D drillhole objects. The ranges can be modified interactively by moving the individual sliders or by specifying an axis range in the data boxes provided.
-
Click inside the X, Y, or Z box, specify the minimum and maximum values and press the Enter key. The 3D symbol/3D drillhole will be updated with the new clipped axis range.
-
To interactively modify the X (Y, Z) axis, use your cursor and move the slider from either end of the slider bar, as shown in the image below.
Your 3D symbol/3D drillhole spatial clip values will be updated interactively as you move the entire slider bar. Note that the spatial clip range will not be affected.
See Also:
- Modify 3D Legend
- Modify Lithology Voxel - Attributes
- Modify Data Voxel - Attributes
- Modify Vector Voxel - Attributes
- Modify Geosurfaces - Attributes
- 3D Drillholes Assays - View and Modify Attributes
- 3D Drillholes Collar - View and Modify Attributes
- 3D Drillholes Lithology - View and Modify Attributes
- 3D Drillholes Traces - View and Modify Attributes
- 3D Symbols – View and Modify Attributes
- Voxel Viewer
- 3D Viewer
- Geosurface Viewer
Got a question? Visit the Seequent forums or Seequent support
© 2023 Seequent, The Bentley Subsurface Company
Privacy | Terms of Use