
Equal Area (Histogram) Transform
The Equal Area (Histogram) Transform dialog enables you to specify a contour interval (set to zero by default).
Zone Colour Ranges using Equal Area (Histogram) Transform
With this method, a histogram is used to allocate the data equally among the different zones, including the "<= min" and "> max" bins.
The term "bin" is derived from how the histogram is calculated. All of the individual numbers or data values are put into "bins" in the histogram. Once all the numbers are placed in a "bin", the number of items in each "bin" is counted based on the number of colour zones selected.
Example:
If an 8000 "bin" histogram created between the min and max values in the data (each bin has the same width) are used, all of the individual numbers or data values will be put into the bins in the histogram. If you have 20 colours, you want to give one colour for each 400 points, so you increment through the bins until you find that including the next bin takes you over the next 400 point increment. The zone interval is a linear interpolation between the individual histogram bin range that "puts you over the top" for that 400 point set, based on the number of values taken from the "last" bin in order to make up an even 400 points for this range.
A data set has 10,000 points, and you want a 20-colour equal-area transform, so each colour should get 500 points. The values themselves range from 0 to 40,000, so first (internally) a histogram is made with 8000 bins:
Bin 1: 0 < x <= 5: 250 points
Bin 2: 5 < x <= 10: 300 points
Bin 3: 10 < x <= 15: 100 points
Bin 4: 15 < x <= 20: 400 points
etc...
Bin 8000: 39995 < x < 40000: 10 points
In order to get 500 points in your first bin, you take the first bin and part of the second bin - 250 + 5/6 * 300, so the range of your first colour zone is all values less than 5 + 5/6*(10-5), or 9.167.
For the next zone, you would take the remaining 50 points in Bin 2, add Bin 3, and continue adding bins until you get up to the next 500 points, etc., so the next range is 50 + 100 + 250 out of Bin 4, giving a range bound of 15 + 250/400*(20 - 15) = 18.125. Therefore, the zones are:
1. x <= 9.167 (min)
2. 9.167 < x <= 18.125
etc…
If a contour level is defined, once the bin boundaries are calculated, they are adjusted to the nearest multiple of the contour interval.
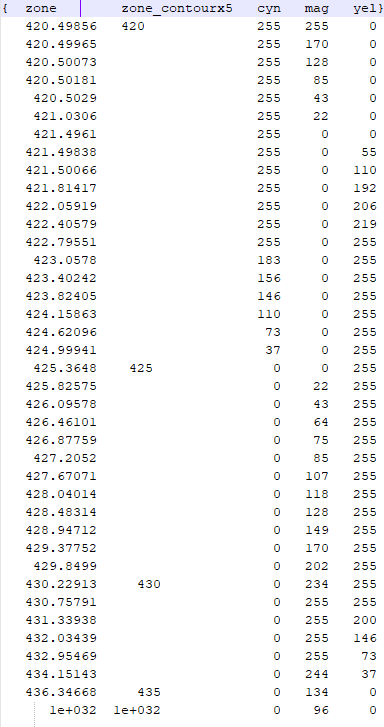
![]() Expand to see an example of a histogram colour zone file:
Expand to see an example of a histogram colour zone file:
Got a question? Visit the Seequent forums or Seequent support
© 2023 Seequent, The Bentley Subsurface Company
Privacy | Terms of Use