
Generate Radioelement Counts
The RPS > Generate Radioelement Counts option (geogxnet.dll(Geosoft.GX.Radiometrics.GenerateElementChannels;Run)*) extracts Region of Interest (ROI) windows for key radiometric elements: Potassium (K), Uranium (U), Thorium (Th), Total Count (TC), and Cosmic.
These ROIs are derived from spectral radiometric data stored in an array channel. The raw values within each ROI window are summed and stored in their respective output channels. For additional information, refer to the Application Notes below.
To rerun the process with previous settings, select the header cell of any channel created by the process, then right-click to open the context menu. The last item in the menu represents the most recently executed process (GX). Select it to reopen the associated dialog. From there, you can rerun the process with the existing settings, adjust parameters before execution, or simply close the dialog. Learn more about Dynamic Process Links (Makers).
Generate Radioelement Counts dialog options
|
Select the array channel that contains the spectral radiometric data. The Start Window and End Window values for the Cosmic channel are automatically populated based on the final element of the array. Script Parameter: SPECTRO.DATA |
|
|
Upward spectral data |
Select the upward-facing spectral data channel used to generate the Upward Uranium (UpU*) channel. This input is required for the Remove Aircraft and Cosmic Effects process. Script Parameter: SPECTRO.UPWARD_DATA |
|
Element Windows – Start/End Energy (keV) Each radioelement has a well-defined energy range. Use the default settings or enter custom values—the graph on the right will automatically update to show the spectral distribution across energy levels. |
|
|
Potassium (K) |
Define the spectral energy window limits for the Potassium windows. Typical energy range (keV): 1370 to 1570. Output channel: K*. Script Parameters: SPECTRO.K0 and SPECTRO.K1 |
|
Uranium (U) |
Define the spectral energy window limits for the Uranium windows. Typical energy range (keV): 1666 to 1860. Output channel: U*. Script Parameters: SPECTRO.U0 and SPECTRO.U1 |
|
Thorium (Th) |
Define the spectral energy window limits for the Thorium windows. Typical energy range (keV): 2410 to 2810. Output channel: Th*. Script Parameters: SPECTRO.TH0 and SPECTRO.TH1 |
|
Total count (TC) |
Define the spectral energy window limits for the Total count windows. Typical energy range (keV): 410 to 2810. Output channel: TC*. Script Parameters: SPECTRO.TC0 and SPECTRO.TC1 |
|
*The suffix entered in the Output channel suffix field is appended to all output channel names.
|
|
|
Cosmic Channel Configuration |
|
|
Start/End Window |
When the Spectral data channel field is populated, the Start Window and End Window fields are automatically set to the last spectral channel. These fields become editable when the Last window option is unchecked. Define the start and end points for the cosmic channel:
Re-enabling the Last window option resets these values to their default, based on the final array element in the spectral data channel. Output channel: cosmic. The suffix entered in the Output channel suffix field is automatically appended to the output channel name.
Script Parameter: SPECTRO.COS0 and SPECTRO.COS1 |
|
Last window |
Checked (default): Automatically sets the cosmic window to the last index (e.g., 255), disabling manual entry. Unchecked: Enables manual input for Start Window and End Window values. Script Parameter: SPECTRO.USE_LAST_WINDOW_FOR_COSMIC [0 - unchecked; 1 - checked] |
|
Output channel suffix |
Enter the suffix to be appended to all output channel names. As you type, the information string below the field updates to reflect the resulting channel names. Each name is formed by combining the suffix with the corresponding radiometric element name. Default: Script Parameter: SPECTRO.GENERATE_ELEMENT_CHANNELS_SUFFIX |
Spectral Distribution of Radioelement Counts |
|
|
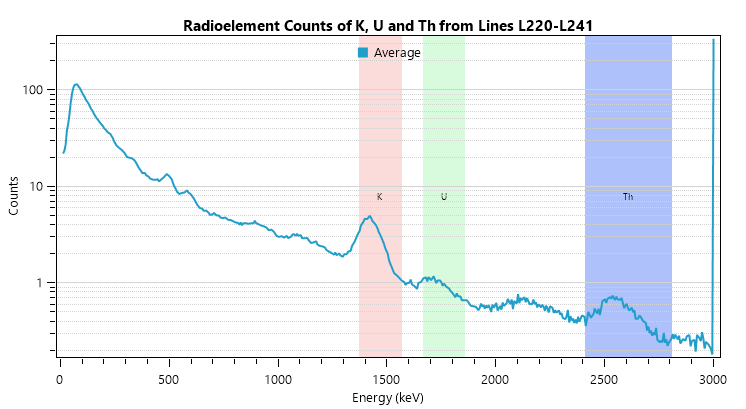
The spectral plot provides a visual reference to help define energy ranges and understand how they span the gamma-ray spectrum. Once a spectral data channel is selected, the right-hand pane displays a plot showing the average spectral counts for Potassium (K), Uranium (U), and Thorium (Th). Below is an example illustrating the radioelement counts across the default energy values. The plot represents the average spectra for all selected lines in the database. Colour-shaded, labeled rectangles indicate the current minimum and maximum keV values for each radioelement window. Adjusting the Start Energy or End Energy fields will dynamically update the width and position of the corresponding Region of Interest (ROI) band on the plot.
|
|
Application Notes
Gamma Ray Measurement
Gamma ray survey data acquisition requires careful consideration of multiple instrument variables (including detector geometry, efficiency, integration time) and environmental factors (e.g., rain and wind drastically affect the dispersion and absorption of gamma rays, most radioactive sources are within the upper 1.5 metres of the ground).
Modern gamma ray spectrometers can record up to 4096 energy channels across a range of 0 to 3.0 MeV. Each channel represents an equal energy interval. The instrument measures the count rate—the number of gamma ray events detected within each channel. These rates are typically low.
For example, an airborne gamma ray spectrometer equipped with 32 litres of NaI (Sodium Iodide) detectors may record one or even zero counts in some high-energy channels during a one-second acquisition period.
A typical airborne gamma ray spectrum is shown below (IAEA [1]):
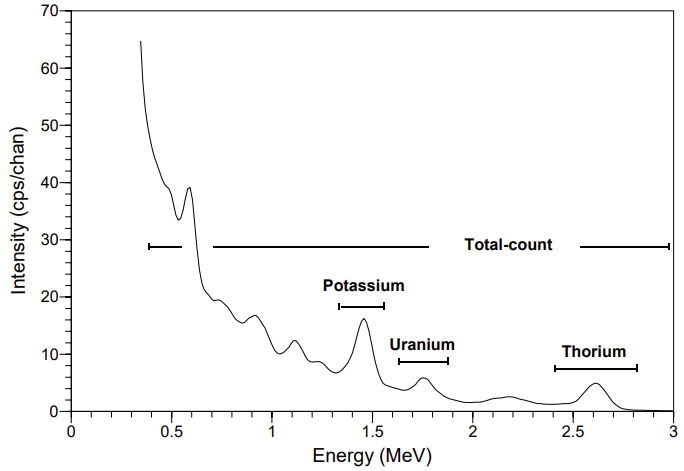
Figure 1: Typical airborne gamma ray spectrum illustrating the positions of conventional energy windows
If the energy spectrum is divided into 1024 channels, each channel spans approximately 2.93 keV (calculated as 3 MeV ÷ 1024). The i-th channel covers the energy range:

Conventional Spectral Windows
The conventional approach to acquiring and processing gamma ray spectrometric data involves monitoring three or four broad spectral energy windows, typically centered around key terrestrial radioelements (IAEA [1], [2]):
Energy Window Nuclide Peak Energy Range (MeV) Total Count – – 0.40 – 2.81 Cesium 137Cs 0.6 0.5 – 0.7 Potassium 40K 1.461 1.37 – 1.57 Uranium 214Bi 1.765 1.66 – 1.86 Thorium 208Tl 2.615 2.41 – 2.81
The potassium (K) energy window detects the 1.46 MeV gamma rays emitted by the isotope ⁴⁰K. The uranium (U) and thorium (Th) energy windows capture gamma emissions from the decay products within their respective radioactive series. These energy windows are generally regarded as the most effective for quantifying concentrations of K, U, and Th. The total-count window provides an overall measure of total radioactivity.
An additional channel captures high-energy radiation above 3000 keV, primarily originating from cosmic sources.
Detection of Fallout and Decay Products:
-
Nuclear fallout isotopes such as ¹³⁷Cs and ¹³⁴Cs are detectable in energy windows centered at 662 keV and 796 keV, respectively.
-
Other decay by-products include: Co-60, Ru-103, Mo-99, I-131, Ar-41, Kr-88
The observed gamma ray spectrum can be modeled as the sum of three terrestrial and three background components:

To reduce the number of pulses the spectrometer must process, an energy threshold is applied. Pulses below this threshold, typically set around 200 keV, are disregarded. During each sampling interval—usually one second—the spectrometer digitally records the count of pulses detected in each channel.
This spectral data, representing the energy distribution of incoming gamma rays, is then analyzed to determine the concentration and spatial distribution of various nuclides present in the ground.
Always refer to your spectrometer’s technical documentation to determine the correct ROI window ranges.
The RPS extension supports spectrometers with more than 256 channels (e.g., 512, 1024, or 4096), enabling broader data processing capabilities.
*GX.NET tools are embedded in the geogxnet.dll file located in the \Geosoft\Desktop Applications\bin folder. To run this GX interactively (outside the menu), first navigate to the bin directory and provide the GX.NET tool in the required format. See the Run GX topic for more guidance.
References
- [1] G. Erdi-Krausz et al. (2003), Guidelines for Radioelement Mapping Using Gamma Ray Spectrometry Data, IAEA-TECDOC-1363, International Atomic Energy Agency.
https://www-pub.iaea.org/MTCD/Publications/PDF/te_1363_web.pdf - [2] IAEA (1991), Airborne Gamma Ray Spectrometer Surveying, Technical Reports Series No. 323, International Atomic Energy Agency.
https://inis.iaea.org/collection/NCLCollectionStore/_Public/22/072/22072114.pdf
See Also:
Got a question? Visit the Seequent forums or Seequent support
Copyright (c) 2025 Bentley Systems, Incorporated. All rights reserved.
Privacy | Terms of Use