
Generate Radioelement Counts
The RPS > Generate Radioelement Counts option (geogxnet.dll(Geosoft.GX.Radiometrics.GenerateElementChannels;Run)*) extracts the region of interest (ROI) windows for the key radiometric elements: potassium (K), equivalent uranium (eU), equivalent thorium (eTh), total count (TC), and cosmic. For more details, refer to the Radioactive Decay and Gamma Ray Emission section.
These ROIs are derived from spectral radiometric data stored in an array channel. The raw values within each ROI window are summed and stored in their respective output channels. For additional information, see the Application Notes below.
To rerun the process with previous settings, select the header cell of any channel generated by this operation, then right-click to open the context menu. The last item in the menu is the most recently executed process (GX). Select it to reopen the associated dialog. From there, you can rerun the process using the existing settings, adjust parameters before execution, or simply close the dialog. Learn more about Dynamic Process Links (Makers).
Generate Radioelement Counts dialog options
|
Select the array channel that contains the spectral radiometric data. The start and end window values for the cosmic channel are automatically populated based on the last element of the array. Script Parameter: SPECTRO.DATA |
|
|
Upward spectral data |
Select the upward-facing spectral data channel used to generate the Upward uranium (UpU*) output channel. This input is required for the Remove Aircraft and Cosmic Effects process. Script Parameter: SPECTRO.UPWARD_DATA |
|
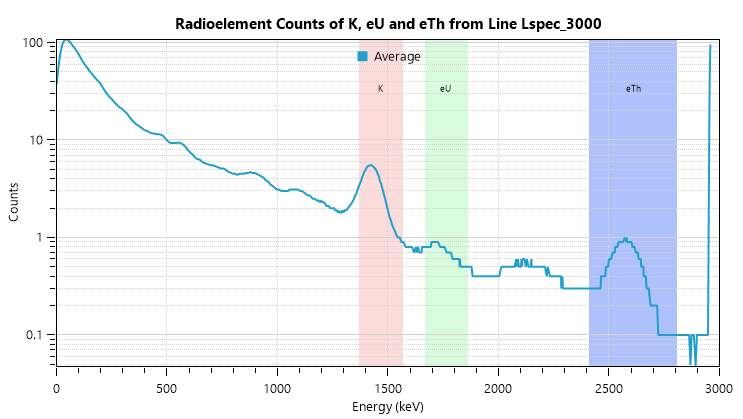
Element Windows – Start/End Energy (keV) Each radioelement has a well-defined energy range. Use the default settings or enter custom values—the graph on the right will automatically update to show the spectral distribution across energy levels. |
|
|
Potassium (K) |
Define the spectral energy window limits for the K window. Typical energy range (keV): 1370 to 1570. Output channel: K*. Script Parameters: SPECTRO.K0 and SPECTRO.K1 |
|
Uranium (eU) |
Define the spectral energy window limits for the equivalent uranium (eU) window. Typical energy range (keV): 1666 to 1860. Output channel: U*. Script Parameters: SPECTRO.U0 and SPECTRO.U1 |
|
Thorium (eTh) |
Define the spectral energy window limits for the equivalent thorium (eTh) window. Typical energy range (keV): 2410 to 2810. Output channel: Th*. Script Parameters: SPECTRO.TH0 and SPECTRO.TH1 |
|
Total count (TC) |
Define the spectral energy window limits for the TC window. Typical energy range (keV): 410 to 2810. Output channel: TC*. Script Parameters: SPECTRO.TC0 and SPECTRO.TC1 |
|
Align energy peaks |
Select the Align energy peaks option to apply a linear energy correction that realigns major radioelement peaks to their expected energies across the full spectral range. This option is used when spectral data are slightly miscalibrated and known peaks appear shifted to lower or higher energies relative to their standard positions (as illustrated by displaced peaks in the spectrum display below). In this condition, the overall spectral shape remains correct, but peaks are offset within the K, eU, or eTh energy windows. This option is disabled by default. When enabled, it remains selected the next time the dialog is opened. See the Application Notes for more details. Script Parameter: SPECTRO.ALIGN_ENERGY_PEAKS [0 - unchecked; 1 - checked] |
|
*The Output channel suffix entry is appended to all output channel names.
|
|
|
Cosmic Channel Configuration |
|
|
Start/End Window |
When the Spectral data channel field is populated, the Start Window and End Window fields are automatically set to the last spectral channel. These fields become editable when the Last window option is unchecked. Define the start and end points for the cosmic channel:
Re-enabling the Last window option resets these values to their defaults, based on the final array element in the spectral data channel. Output channel: cosmic. The suffix entered in the Output channel suffix field is automatically appended to the output channel name.
Script Parameter: SPECTRO.COS0 and SPECTRO.COS1 |
|
Last window |
Checked (default): Automatically sets the cosmic window to the last index, disabling manual entry. Unchecked: Enables manual input for Start Window and End Window values. Script Parameter: SPECTRO.USE_LAST_WINDOW_FOR_COSMIC [0 - unchecked; 1 - checked] |
|
Output channel suffix |
Enter a suffix to append to all output channel names. Default: As you type, the information string below the field updates to show the resulting channel names. Each name is formed by combining the radiometric element name with the suffix (letters and numbers only). Output channels follow the pattern element_suffix. Script Parameter: SPECTRO.GENERATE_RADIOELEMENT_COUNTS_OUTPUT_SUFFIX |
Spectral Distribution of Radioelement Counts |
|
|
The spectral plot provides a visual reference for defining energy windows and understanding the distribution of radioelement gamma‑ray counts across the energy spectrum. When a spectral data channel is selected, the right-hand pane displays a plot of averaged spectral counts over the full energy range. The example illustrates radioelement responses across the default energy values. The plot displays the average spectrum derived from all selected lines in the database. Axes Grid Lines Grey grid lines are overlaid on the spectral plot for clarity:
Radioelement Energy Windows Colour‑shaded, labeled bands highlight the current energy windows (minimum to maximum, in keV) for the following radioelements:
For additional background information, see the Radioactive Decay and Gamma Ray Emission section. Modifying the Start Energy or End Energy fields dynamically recalculates and updates the width and position of the associated Region of Interest (ROI) band on the spectral plot.
|
|
Application Notes
Gamma-ray survey data acquisition requires careful consideration of both instrument-related and environmental factors. Instrument-related factors include detector geometry, efficiency, and integration time. Environmental conditions—such as rainfall, wind, and atmospheric pressure—can significantly influence the dispersion and attenuation of gamma rays. Because gamma rays are readily absorbed by denser materials, detected signals primarily originate from radioactive sources located within the upper approximately 1.5 m of the ground.
Gamma-Ray Measurement
Gamma-ray spectrometers measure radiation in the energy range of approximately 0–3000 keV. Detected gamma-ray counts are recorded in an array (also referred to as a spectrum) that spans this full energy range. Each array element represents a discrete energy interval, with consecutive elements corresponding to progressively increasing energy levels. The measured energy of each gamma ray determines the spectral element to which it is assigned. Although modern spectrometers can record spectra with up to 4096 elements, a resolution of 1024 elements is most commonly used in practice.
As gamma rays travel through the atmosphere, they lose energy through interactions with air molecules and other particles. Consequently, low‑energy gamma rays occur more frequently than high‑energy ones. This results in high count rates at the low‑energy end of the spectrum, while the high‑energy end may contain relatively few counts or even empty elements. A theoretical airborne gamma-ray spectrum illustrating this distribution and the locations of standard energy windows is shown in Figure 1 (IAEA [1]):
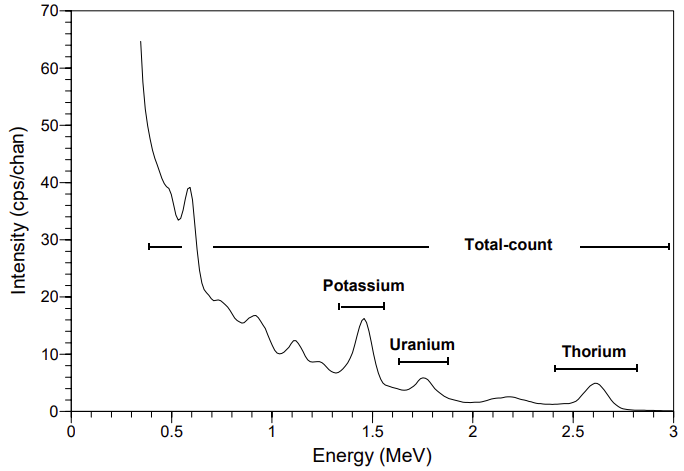
Figure 1: Typical airborne gamma-ray spectrum showing the positions of the conventional energy windows (1 MeV = 1000 keV).
Conventional Spectral Windows
Conventional gamma-ray spectrometric data acquisition and processing involves monitoring three or four relatively broad spectral windows associated with key naturally occurring radioelements (IAEA [1], [2]). These windows are defined to capture characteristic gamma ray emissions from potassium, uranium, and thorium, as well as a total count window spanning most of the terrestrial energy range.
Energy Window Nuclide Peak Energy (keV) Standard Energy Range (keV) Potassium (K) 40K 1460 1370–1570 Uranium (U) 214Bi 1765 1660–1860 Thorium (Th) 208Tl 2614 2410–2810 Total Count (TC) – – 400–2810
The potassium (K) window records gamma rays emitted directly by the decay of the isotope ⁴⁰K. Uranium and thorium are measured indirectly through gamma rays emitted by their daughter products in the respective decay series. The 214Bi and 208Tl windows are considered the most reliable indicators of uranium and thorium concentrations, respectively. Counts in these windows are scaled to estimate equivalent uranium eU and equivalent thorium eTh.
Gamma-Ray Spectral Channels and Fractional Windows
When a gamma-ray energy spectrum is divided into 1024 elements spanning the energy range 0–3000 keV, the first 1023 elements record gamma rays originating primarily from terrestrial sources, while the final element includes all gamma rays with energies greater than or equal to 3000 keV, which are dominated by cosmic radiation. Each element therefore represents a fixed energy width of approximately 2.93 keV, such that the i‑th element spans the energy range:

Because standard radiometric energy windows are defined in physical energy units (keV), their boundaries rarely align exactly with discrete element limits. As a result, these windows correspond to fractional (non‑integer) element indices rather than exact element boundaries.
To account for this difference, fractional energy windows are used to more accurately integrate gamma-ray counts over the specified energy ranges by allowing the start and end of a window to fall within elements rather than at whole element boundaries. For example, as shown in the table below, the potassium (K) window defined from 1370 to 1570 keV maps to fractional indices of approximately 467.6 to 535.9. Similarly, the uranium (U) window from 1660 to 1860 keV spans indices 566.6 to 634.9, while the thorium (Th) window from 2410 to 2810 keV spans indices 822.6 to 959.1.
Fractional window integration accounts for the proportional contribution of the first and last elements that are only partially covered by the window. This ensures that summed or averaged counts accurately represent the gamma-ray signal within the defined physical energy limits.
The table below lists the standard radiometric energy windows and their corresponding fractional indices for different spectral array sizes. For each array size, the effective element energy width is shown, and the start and end indices indicate where the specified energy window falls within the spectrum.
Radioelement Standard Energy Range (keV) Spectral Array Size / (Element Width) 256
(11.72)512
(5.86)1024
(2.93)Potassium (K)
1370–1570
116.91–133.97
233.81–267.95
467.63–535.89
Uranium (U)
1660–1860
141.65–158.72
283.31–317.44
566.61–634.88
Thorium (Th)
2410–2810
205.65–239.79
411.31–479.57
822.61–959.15
Total Count (TC)
400–2810
34.13–239.79
68.27–479.57
136.53–959.15
Detection of Fallout and Decay Products
Nuclear fallout isotopes, such as ¹³⁷Cs and ¹³⁴Cs, are detectable in energy windows centred around 662 keV and 796 keV, respectively. Other detectable decay products may include isotopes such as ⁶⁰Co, ¹⁰³Ru, ⁹⁹Mo, ¹³¹I, ⁴¹Ar, and ⁸⁸Kr.
The observed gamma-ray spectrum can be modeled as a sum of terrestrial components and background contributions, including cosmic radiation and atmospheric sources.

To reduce processing load, an energy threshold—typically around 200 keV—is applied so that pulses below this level are ignored. During each sampling interval, commonly one second, the spectrometer records the number of pulses detected in each channel. This spectral data, which represents the energy distribution of incoming gamma rays, is then analyzed to determine the concentration and spatial distribution of radionuclides present in the ground.
Adjust Energy Bin Sizes (Linear Energy Correction)
Radiometric spectral data can exhibit small energy shifts when radioelement peaks no longer align with their standard energies. This behaviour most commonly results from temperature‑related sensor changes, which slightly expand the effective energy range and shift the spectrum toward higher energies by a few bins. As a result, the K, eU, and eTh peaks may be displaced from the centres of their expected windows, even though the overall spectral shape remains correct.
The Align energy peaks option corrects this condition by applying a linear adjustment to the spectral energy scale while leaving the counts in each bin unchanged. A single, optimal linear transformation is applied across the entire spectrum to restore correct peak positioning without redistributing or re‑binning spectral data.
Peak alignment is performed using a linear regression calibration that derives a constant keV‑per‑bin relationship for the full spectral array. This approach preserves the original count data while correcting the energy scale.
Enable Align energy peaks when:
-
Radiometric spectra show small energy offsets.
-
Major peaks (for example, ¹³⁷Cs, ⁴⁰K, ²¹⁴Bi, or ²⁰⁸Tl) do not align with their expected energies.
-
The spectrum appears correct, but peaks are slightly displaced within the highlighted K, eU, or eTh windows in the spectrum display.
Calibration Process
Peak alignment is performed using a global linear recalibration of the spectral energy scale. The process consists of the following steps:
-
Anchor Peak Detection
Four reference (anchor) radioelement peaks are detected in the Compton‑continuum–subtracted downward‑looking spectrum:
-
¹³⁷Cs — 662 keV
-
⁴⁰K — 1460 keV
-
²¹⁴Bi (eU) — 1765 keV
-
²⁰⁸Tl (eTh) — 2614 keV
These anchor peaks correspond to the expected energy positions for the highlighted K, eU, and eTh regions in the spectrum display.
-
-
Linear Regression Calibration
A four‑point linear regression is performed using the detected anchor peaks to compute an optimal linear energy calibration. (The regression may apply internal weighting to specific radioelement peaks to improve calibration stability.)
The regression determines:
-
Slope — energy per bin (keV/bin)
-
Intercept — energy at bin index 0 (keV)
The resulting linear transformation is applied uniformly across the entire spectrum.

-
Application of the Correction
-
The correction is calculated using the downward‑looking spectrum.
-
The same correction is applied to both downward and upward spectra (if upward spectral data is available).
-
Nearby peaks (for example, ¹³⁴Cs at 660 keV) are not explicitly targeted, but are corrected implicitly by the same linear transformation.
Energy Correction Log
When Align energy peaks is enabled, an energy correction log file is written to the directory specified by the GEOTEMP environment setting (for example, %LocalAppData%\Temp\GeosoftTemp, depending on configuration).
Log file format: energy_correction_<timestamp>.log
The log records:
-
The input database, spectrum channel, and number of energy bins.
-
For each anchor peak: the nuclide, expected peak energy (keV), search window (keV), and detected bin index.
-
The applied linear calibration: calibration formula, slope (keV/bin), and intercept (keV).
These values describe the optimal linear keV‑per‑bin calibration derived from the detected anchor peaks.
Radioactive Decay and Gamma Ray Emission
Potassium concentrations in rocks and soils are commonly estimated using gamma‑ray spectrometry, which detects the 1461 keV gamma rays emitted by the radioactive isotope potassium-40 (40K). Unlike 40K, which decays directly to a stable daughter isotope, uranium‑238 (238U) and thorium-232 (232Th) decay through long chains of intermediate, unstable daughter products.
For gamma-ray spectrometry, the energies associated with these decay series are identified through their most prominent daughter isotopes:
-
238U → 214Bi (bismuth)
-
232Th → 208Tl (thallium)
Characteristic gamma‑ray energy peaks — most notably the 1765 keV line from 214Bi and the 2615 keV line from 208Tl — serve as markers for the uranium and thorium decay chains. The intensities of these emissions are then scaled to estimate concentrations of uranium and thorium, reported as equivalent uranium (eU) and equivalent thorium (eTh).
*GX.NET tools are embedded in the geogxnet.dll file located in the \Geosoft\Desktop Applications\bin folder. To run this GX interactively (outside the menu), navigate to the bin directory and specify the GX.NET tool in the required format. See the Run GX topic for more guidance.
References
- [1] G. Erdi-Krausz et al. (2003), Guidelines for Radioelement Mapping Using Gamma Ray Spectrometry Data, IAEA-TECDOC-1363, International Atomic Energy Agency.
https://www-pub.iaea.org/MTCD/Publications/PDF/te_1363_web.pdf - [2] IAEA (1991), Airborne Gamma Ray Spectrometer Surveying, Technical Reports Series No. 323, International Atomic Energy Agency.
https://inis.iaea.org/collection/NCLCollectionStore/_Public/22/072/22072114.pdf
See Also:
Got a question? Visit the Seequent forums or Seequent support
Copyright (c) 2026 Bentley Systems, Incorporated. All rights reserved.
Privacy | Terms of Use