What’s New in Leapfrog Geo 4.3
New features and enhancements in Leapfrog Geo version 4.3 are:
- Variable Drillhole Radius Scaling
- Drillhole Trace Object
- acQuire Update
- Mesh Clean Up Improvements
- Reloading Meshes
- Structural Data Analysis
- Graphs and Statistics Refresh
- Cross Section Improvements
- Sub-Blocked Model Export Improvements
- DWG Export
- Hyperlinks in Comments and Notes
- Block Estimate Interrogation
- Combined Estimator
- Improved Grade Tonnage Reports
- Improved Block Model Table of Statistics
- Estimation From Points
- Central Publishing Improvements
- Single Sign-In for My Leapfrog and View
- Planned Drillhole Groups
- Changes to Flow Modelling Organisation
See Updates to Previous Versions for information on changes to earlier versions of Leapfrog Geo.
Variable Drillhole Radius Scaling
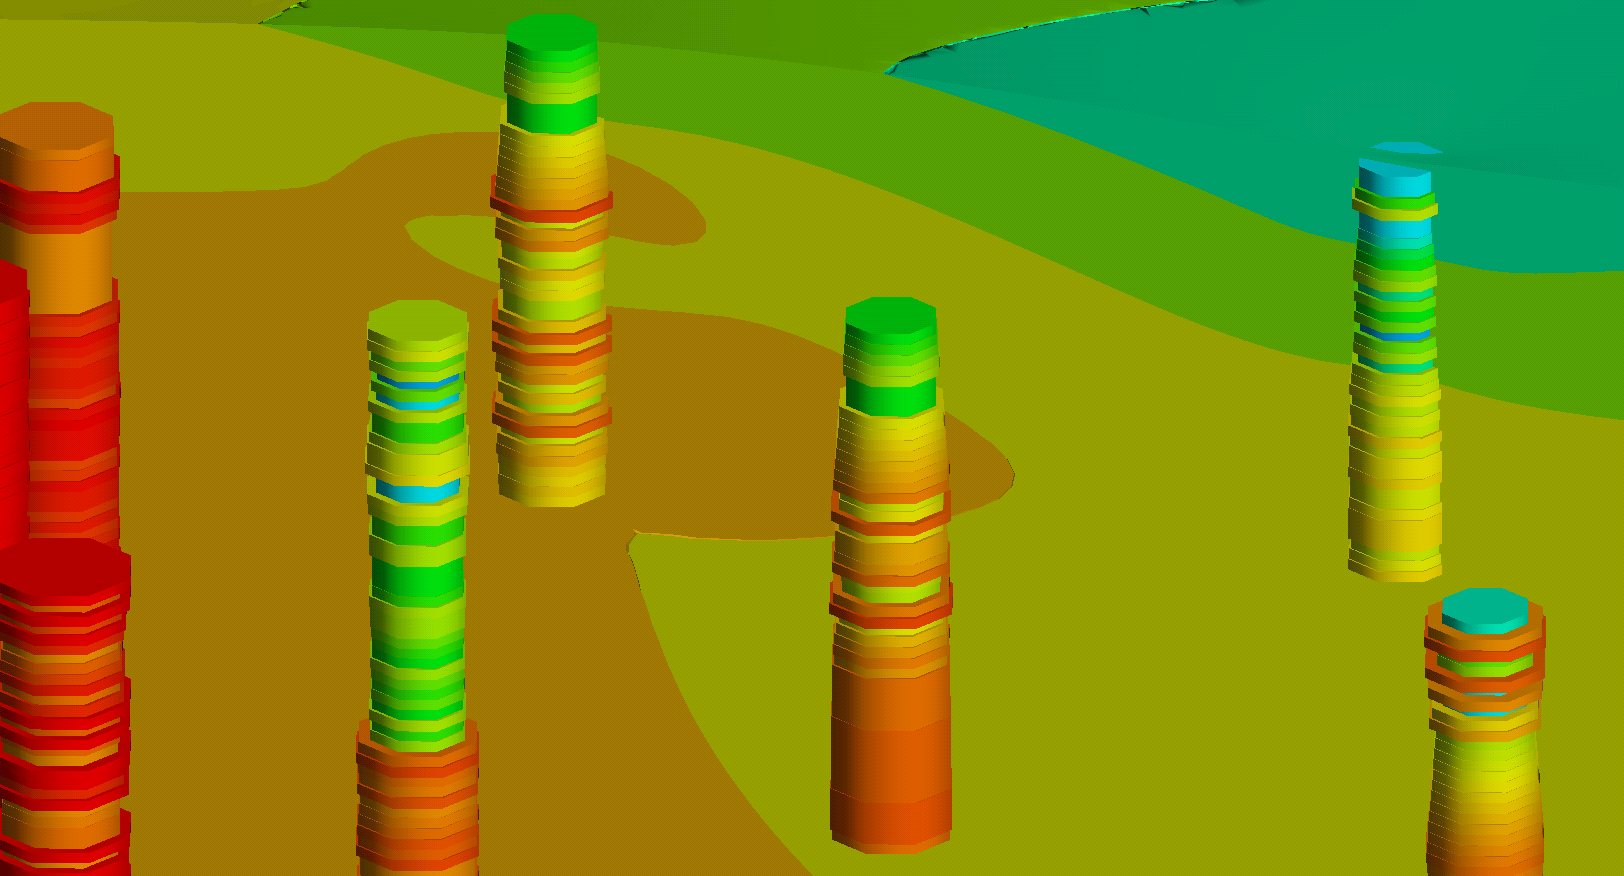
When visualising downhole numerical data you can now scale the width of the drillhole cylinder by another column of data values from your drillhole database.
Drillhole Trace Object
There is a new Drillhole traces object in the Drillholes folder that allows for independent display of drillhole traces in the scene:
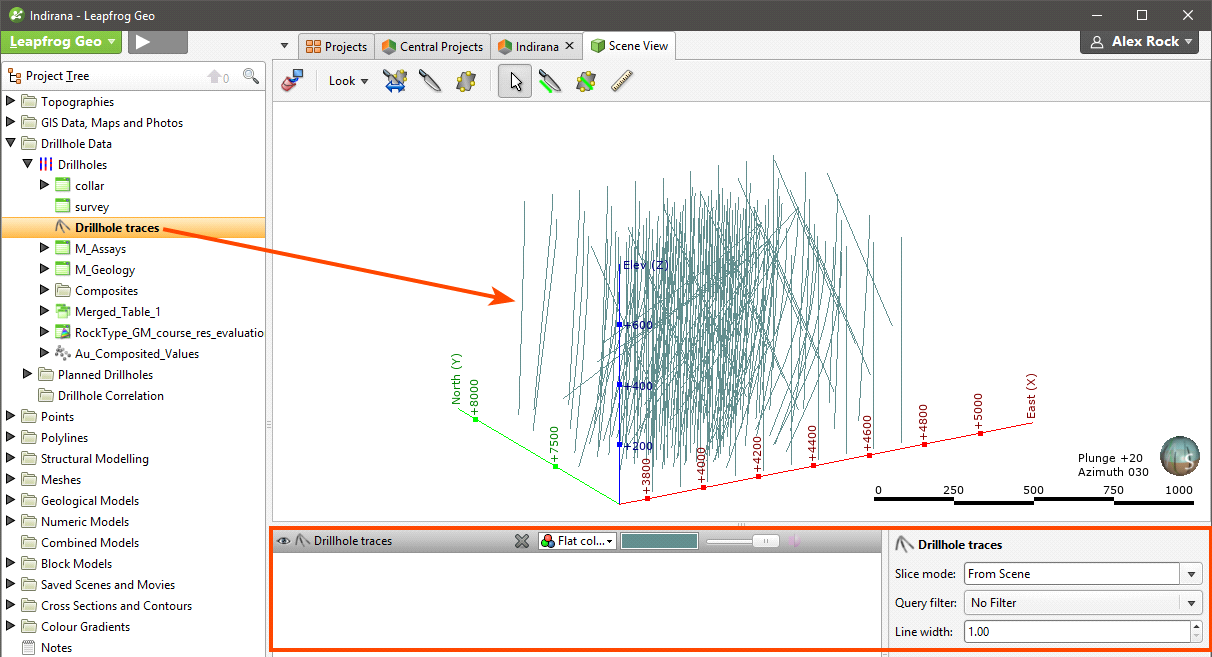
Traces can be displayed using a flat colour that can be changed using the shape list. Trace display properties can be changed in the properties panel.
acQuire Update
The acQuire API has been updated to make loading and refreshing drillhole data easier. This includes the introduction of acQuire’s Smart Refresh. Smart Refresh obtains the latest drilling data from the acQuire database without having to reload the entire contents of the database. This can greatly reduce the amount of data transfer and so speed up data updates. Smart Refresh will only include drillholes relating to data that has been changed since the database was last updated in Leapfrog Geo.
See Connecting to an acQuire Database for more information.
Mesh Clean Up Improvements
Surfaces and imported meshes may have overlapping triangles (known as self-intersections) that prevent the mesh from being usable in further mesh operations. An option has been added to remove self-intersections. See Cleaning Up a Mesh for more information.
Reloading Meshes
Meshes imported into Leapfrog Geo and created from extracting mesh parts can now be reloaded. Right-click on the mesh, select Reload Mesh, then navigate to the file that should be used.
Structural Data Analysis
The statistics displayed for stereonets has previously been limited to Fisher statistics, which are calculated for polar data. In addition, it was not possible to view statistics on structural data or lineations in the project tree. Bingham statistics, which are more useful for folded geologies, are now available. The addition of Bingham statistics has resulted in several changes to stereonets. The first is the addition of two new buttons in the stereonet toolbar and the removal of the Statistics button.
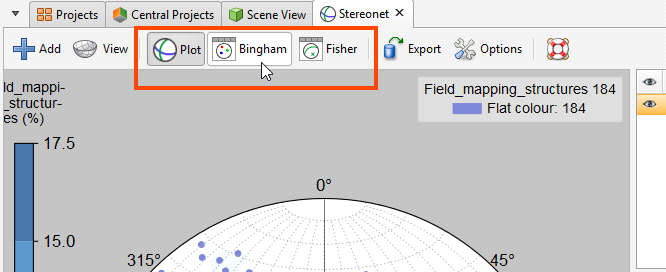
Clicking the Plot, Bingham and Fisher buttons switches between the display of the stereonet and the statistics tables.
You can also view statistics on structural data tables and lineations.
See Stereonets and Viewing Statistics on Structural Data for more information.
Graphs and Statistics Refresh
A Table of Statistics option has been added to Statistics. Together with other improvements, this provides more options and controls when working with statistics and graphs.
- Multiple categories can be populated and grouped
- Statistics columns can be selected
- Both interval length-weighted and un-weighted statistics can be displayed
- Query filters can be applied
- Histograms can be accessed directly from the numeric data column
- Data shown in plots is linked to data in the 3D scene so that you can select in the plot and visualise the selected dataset in the scene, and vice versa
See Statistics for more information.
Cross Section Improvements
A number of improvements have been made to the section editor, including:
Line Evaluations
See Adding and Styling Lines for more information.
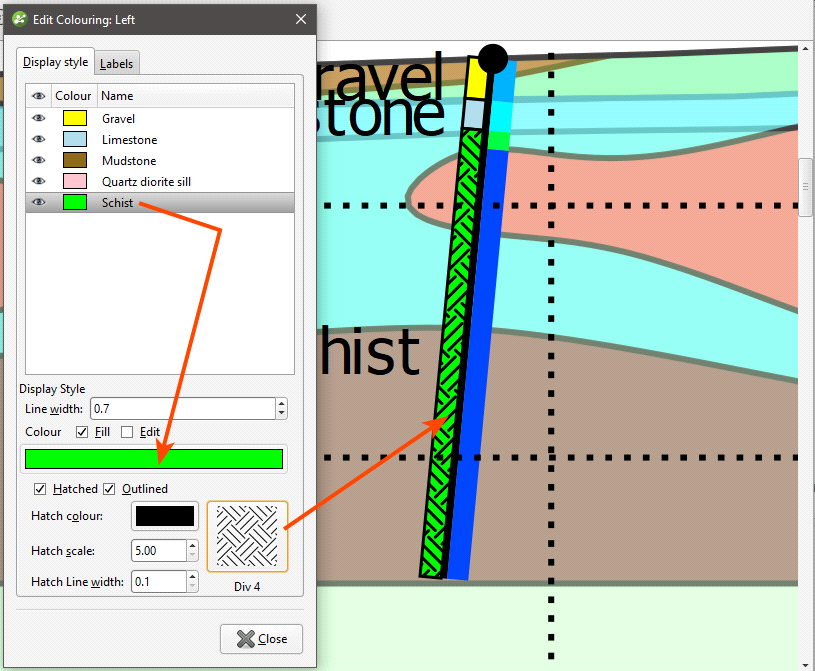
Hatching on Drillholes
When laying out cross sections it is now possible to display hatching on drillholes.
See Adding and Styling Drillholes and Planned Drillholes for more information.
Arrange Labels on Cross Sections
Where multiple drillholes are evaluated in a confined space, cross section layouts can become hard to read or even overlap. Now it is easy to arrange the collar labels into a custom composition by simply dragging the collar labels to the desired location.
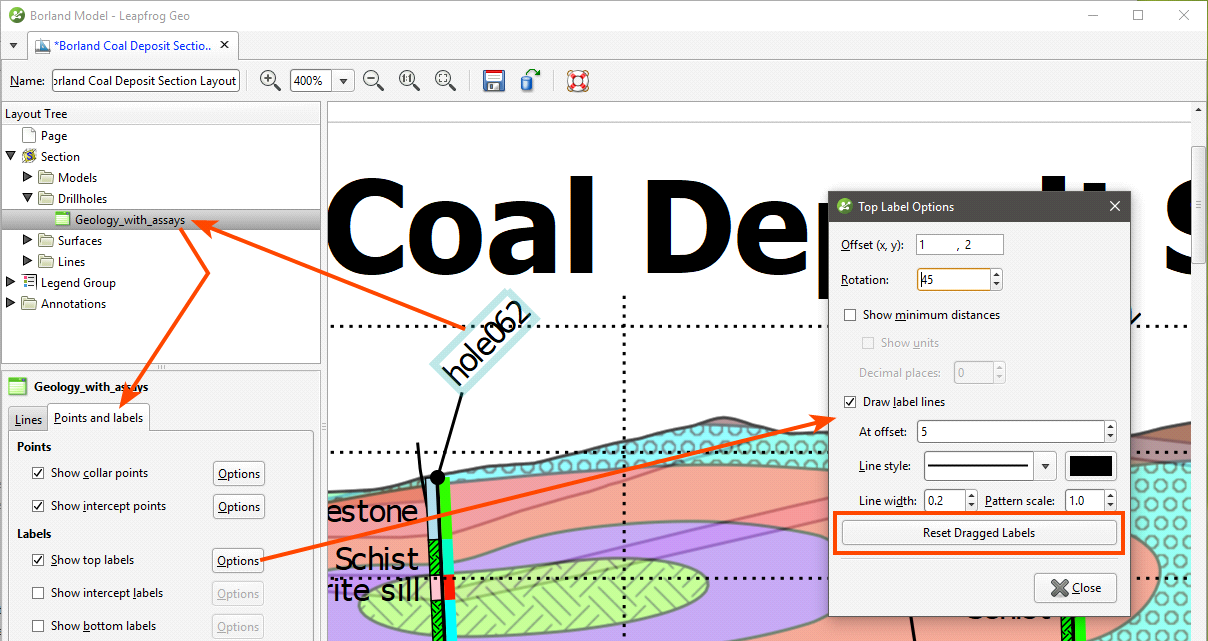
See Adding and Styling Drillholes and Planned Drillholes for more information.
Sub-Blocked Model Export Improvements
The advanced block model export introduced in Leapfrog Geo 4.2 has been added to sub-blocked models exported in Datamine format.
DWG Export
DWG is now available as an export format for:
- Sections
- Serial sections
- Points
- Numeric model values
- Polylines
- Meshes
DWG export uses the same data in the same hierarchical format used for DXF export.
Hyperlinks in Comments and Notes
Comments and notes in Leapfrog Geo projects now support hyperlinks. URLs entered in comments and notes will automatically be hyperlinked.
Central Publishing Improvements
It is now possible to publish more types of data to Central, including planned drillholes, downhole points, GIS data, images, textures, cross sections and polylines.
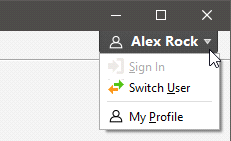
Single Sign-In for My Leapfrog and View
There is a new menu in the upper right-hand corner of the Leapfrog Geo window that lets you sign in to My Leapfrog and View:
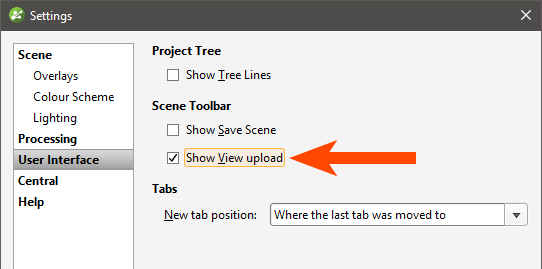
Because how you sign in to View has changed, the settings that were in the View panel of the Settings screen are no longer necessary. There is a new option in the User Interface panel, Show View upload:
Planned Drillhole Groups
Planned drillholes are now managed in groups for greater efficiency and consistency when preparing for future ground investigations.
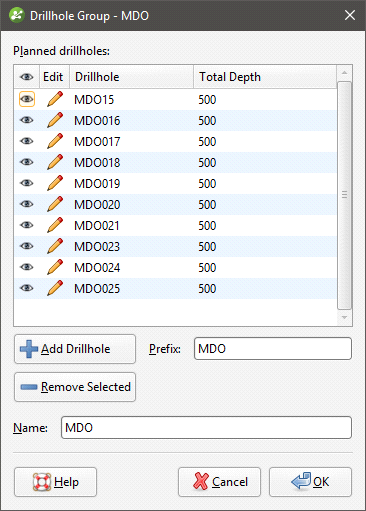
See Planning Drillholes for more information.
Block Estimate Interrogation
The new block estimate interrogation tool exposes the data used to produce an estimate. It is useful for checking estimates evaluated on block models and inspecting the data used to create an estimator. Right-click on a block model in the project tree and select Interrogate Estimator.
See Block Estimate Interrogation for more information.
Combined Estimator
The new combined estimator available for EDGE displays more than one estimation at a time, evaluated on a block model. The aim is to get more than one domained estimation displaying a combined estimation result column or attribute on a block model. This is useful for:
- Allowing multiple estimation passes over the same domain, with more relaxed search criteria for subsequent passes
- Estimating for different domains, either separate or overlapping, and evaluating them on the same block model
Combined estimators are organised into a hierarchy, which means a preference can be indicated where different estimates are produced for the same block. Estimators lower in the hierarchy will be used when the higher-priority estimate results in a Without Grade or Outside result.
See Viewing Statistics for more information.
Improved Grade Tonnage Reports
Grade tonnage curves have been removed from the calculated columns tool and promoted to be their own object under a block model. In addition, there have been a number of feature enhancements.
See Grade Tonnage Graphs for more information.
Improved Block Model Table of Statistics
In addition to the enhancements described above, block model statistics now include the ability to include density weighting in order to calculate and report tonnage. This functionality also allows for nested categorical groups.
Estimation From Points
It is now possible to build a domained estimation from points with values imported into the Points folder. All functions, including variogram modelling and search neighborhood definition, work with imported points.
Changes to Flow Modelling Organisation
How flow models appear in the project tree has been reorganised. Options available by right-clicking on the Hydrogeology folder are now organised by type of model. In addition the term “Structured Model” is now used for MODFLOW.
Got a question? Visit the My Leapfrog forums at https://forum.leapfrog3d.com/c/open-forum or technical support at http://www.leapfrog3d.com/contact/support