
Analysis
Understanding the geological features that dictate the shape and extent of an ore body is crucial for creating realistic mineral deposit models. However, ore bodies are controlled by local features that are structurally complex. In practice, this level of detailed modelling is often challenging due to the limited or inconsistent availability of data and the amount of time required for such comprehensive analysis.
Producing ellipsoids
Driver's anisotropy estimation tool uses Spatial Continuity Mapping (SCM) to automatically map the geological continuity between drillhole samples. For each attribute, Driver quickly reveals the features and patterns that control the 3D geometry of mineralisation. Insights are constructed directly from the data, meaning that they form a machine-generated, quantifiable data object represented as a field of local ellipsoids where each analysis centre represents the strength and orientation of continuity in all three axes. This can be used as structural data to guide and inform implicit models in modelling software such as Leapfrog Geo.
Spatial Continuity Mapping works by:
- Determining a series of control points, also called centres, that are based on a threshold value. Control points occur above or equal to the threshold value and are spaced according to the chosen resolution. They are preferentially selected close to the middle of above-threshold intercepts, e.g. the midpoints of veins.
- Tracing the 3D extent of directional continuity from each control point.
- Modelling the local continuity as a local anisotropy ellipsoid using the raw 3D continuity information. One ellipsoid is modelled at each control point and will contain information such as range, dip, dip direction and pitch, and anisotropy estimation metrics such as ellipticity, data support and confidence.
Once produced, the ellipsoids constitute a locally varying anisotropy field that is a form of data-driven structural information, as can be seen in this example:
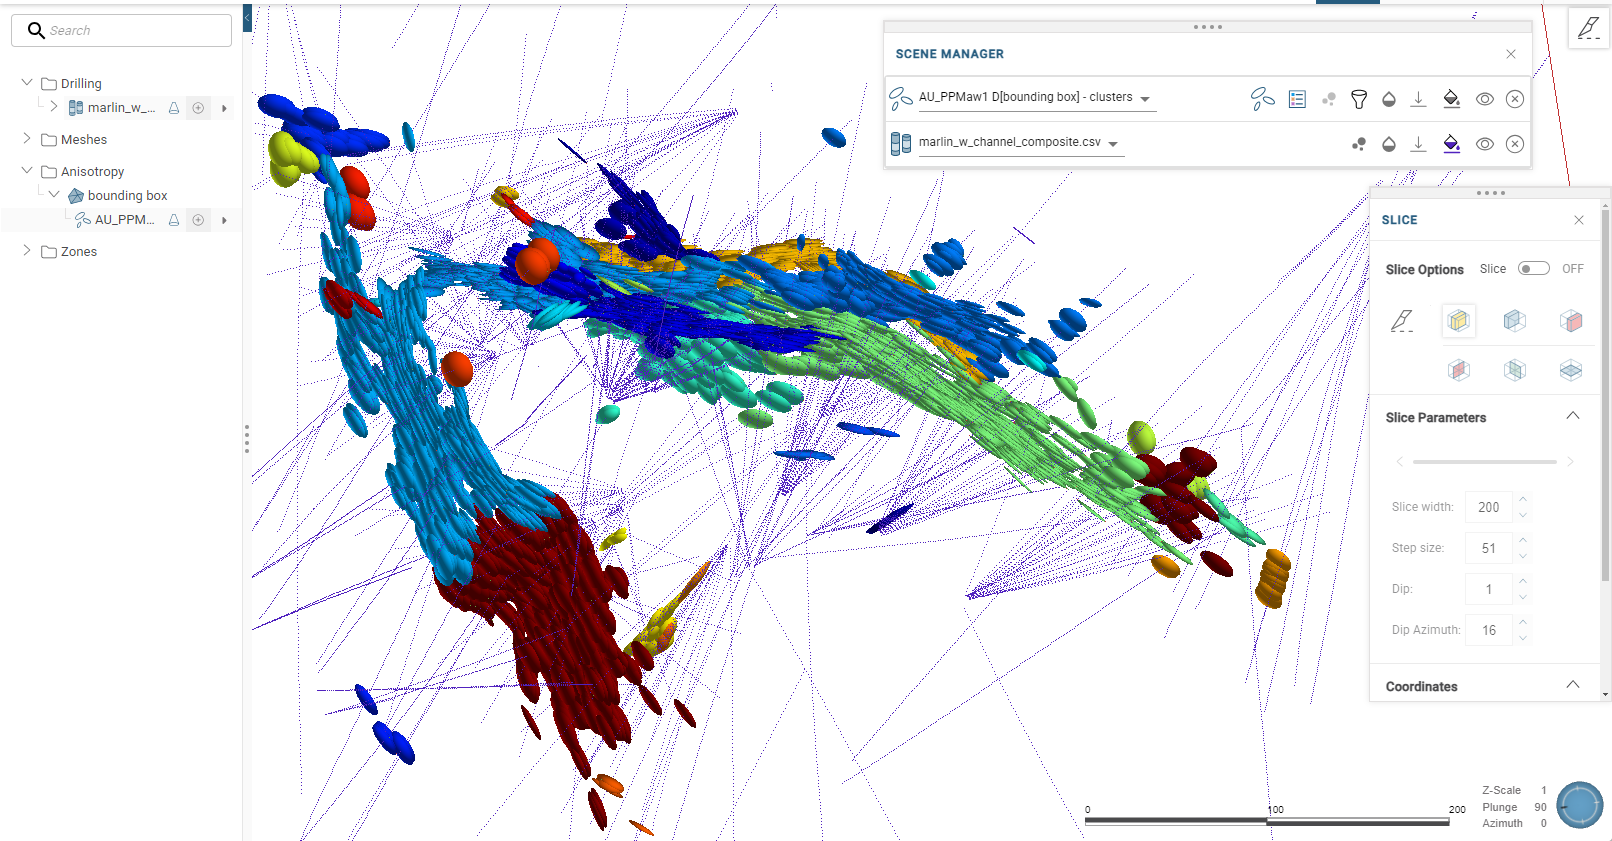
This information can be used to interpret the structural features of a deposit or used as inputs to inform and guide downstream models.
The process of producing ellipsoids is described in the Anisotropy estimations topic.
Regularising changes in continuity
Techniques for regularising the changes in continuity across the data area can be applied to assist in using a Driver analysis in downstream modelling tools. Driver provides two strategies to re-evaluate, or regularise, local ellipsoids; these are described in the Anisotropy grids and global anisotropies topic.
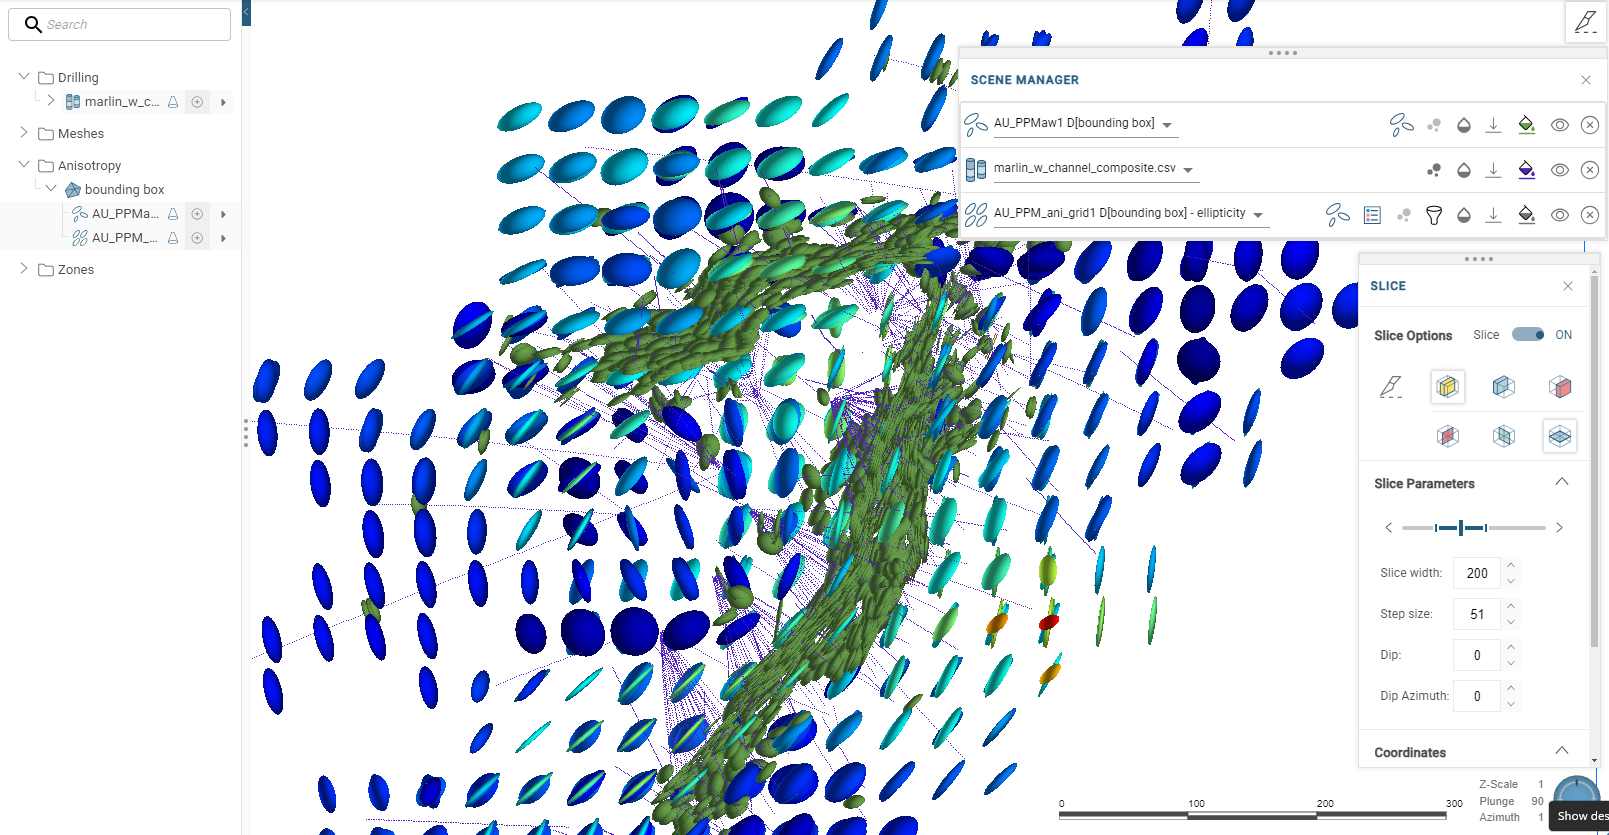
Here an anisotropy estimation is displayed against an anisotropy grid.
Using zones to test hypotheses
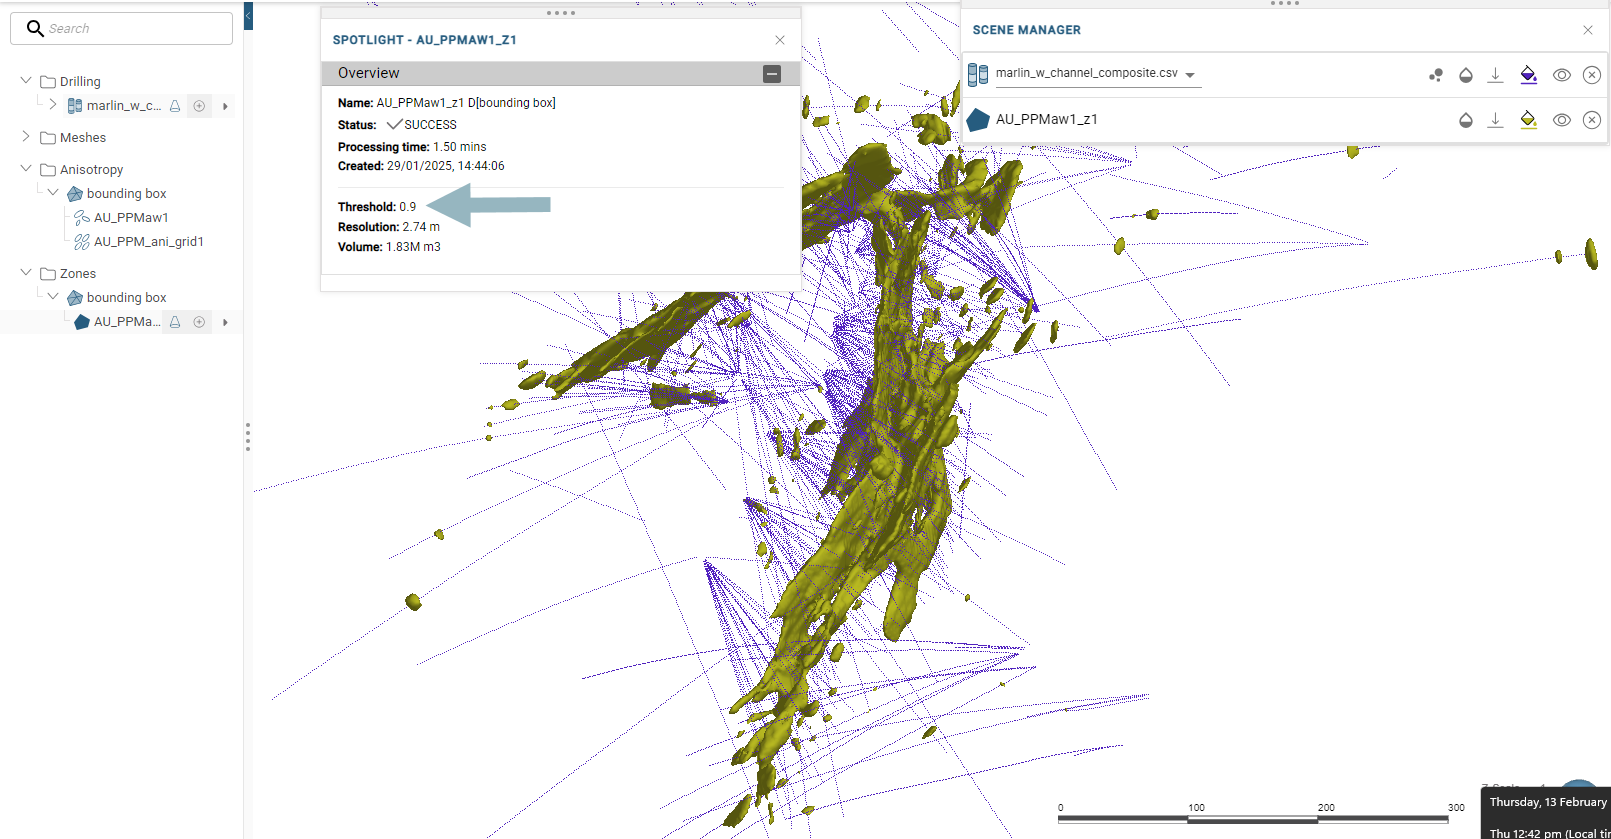
Local ellipsoids identified by Driver can be used to create 3D wireframes that delineate the spatial extents of continuity. These are called zones. Zones are useful for testing spatial hypotheses, making comparisons and iterating using different thresholds. Here is a zone created in Driver with a threshold of 0.9:
See the Defining zones topic.